Williams R Zone Scalper v1.0[BullByte]Originality & Usefulness
Unlike standard Williams R cross-over scripts, this strategy layers five dynamic filters—moving-average trend, Supertrend, Choppiness Index, Bollinger Band Width, and volume validation —and presents a real-time dashboard with equity, PnL, filter status, and key indicator values. No other public Pine script combines these elements with toggleable filters and a custom dashboard. In backtests (BTC/USD (Binance), 5 min, 24 Mar 2025 → 28 Apr 2025), adding these filters turned a –2.09 % standalone Williams R into a +5.05 % net winner while cutting maximum drawdown in half.
---
What This Script Does
- Monitors Williams R (length 14) for overbought/oversold reversals.
- Applies up to five dynamic filters to confirm trend strength and volatility direction:
- Moving average (SMA/EMA/WMA/HMA)
- Supertrend line
- Choppiness Index (CI)
- Bollinger Band Width (BBW)
- Volume vs. its 50-period MA
- Plots blue arrows for Long entries (R crosses above –80 + all filters green) and red arrows for Short entries (R crosses below –20 + all filters green).
- Optionally sets dynamic ATR-based stop-loss (1.5×ATR) and take-profit (2×ATR).
- Shows a dashboard box with current position, equity, PnL, filter status, and real-time Williams R / MA/volume values.
---
Backtest Summary (BTC/USD(Binance), 5 min, 24 Mar 2025 → 28 Apr 2025)
• Total P&L : +50.70 USD (+5.05 %)
• Max Drawdown : 31.93 USD (3.11 %)
• Total Trades : 198
• Win Rate : 55.05 % (109/89)
• Profit Factor : 1.288
• Commission : 0.01 % per trade
• Slippage : 0 ticks
Even in choppy March–April, this multi-filter approach nets +5 % with a robust risk profile, compared to –2.09 % and higher drawdown for Williams R alone.
---
Williams R Alone vs. Multi-Filter Version
• Total P&L :
– Williams R alone → –20.83 USD (–2.09 %)
– Multi-Filter → +50.70 USD (+5.05 %)
• Max Drawdown :
– Williams R alone → 62.13 USD (6.00 %)
– Multi-Filter → 31.93 USD (3.11 %)
• Total Trades : 543 vs. 198
• Win Rate : 60.22 % vs. 55.05 %
• Profit Factor : 0.943 vs. 1.288
---
Inputs & What They Control
- wrLen (14): Williams R look-back
- maType (EMA): Trend filter type (SMA, EMA, WMA, HMA)
- maLen (20): Moving-average period
- useChop (true): Toggle Choppiness Index filter
- ciLen (12): CI look-back length
- chopThr (38.2): CI threshold (below = trending)
- useVol (true): Toggle volume-above-average filter
- volMaLen (50): Volume MA period
- useBBW (false): Toggle Bollinger Band Width filter
- bbwMaLen (50): BBW MA period
- useST (false): Toggle Supertrend filter
- stAtrLen (10): Supertrend ATR length
- stFactor (3.0): Supertrend multiplier
- useSL (false): Toggle ATR-based SL/TP
- atrLen (14): ATR period for SL/TP
- slMult (1.5): SL = slMult × ATR
- tpMult (2.0): TP = tpMult × ATR
---
How to Read the Chart
- Blue arrow (Long): Williams R crosses above –80 + all enabled filters green
- Red arrow (Short) : Williams R crosses below –20 + all filters green
- Dashboard box:
- Top : position and equity
- Next : cumulative PnL in USD & %
- Middle : green/white dots for each filter (green=passing, white=disabled)
- Bottom : Williams R, MA, and volume current values
---
Usage Tips
- Add the script : Indicators → My Scripts → Williams R Zone Scalper v1.0 → Add to BTC/USD chart on 5 min.
- Defaults : Optimized for BTC/USD.
- Forex majors : Raise `chopThr` to ~42.
- Stocks/high-beta : Enable `useBBW`.
- Enable SL/TP : Toggle `useSL`; stop-loss = 1.5×ATR, take-profit = 2×ATR apply automatically.
---
Common Questions
- * Why not trade every Williams R reversal?*
Raw Williams R whipsaws in sideways markets. Choppiness and volume filters reduce false entries.
- *Can I use on 1 min or 15 min?*
Yes—adjust ATR length or thresholds accordingly. Defaults target 5 min scalping.
- *What if all filters are on?*
Fewer arrows, higher-quality signals. Expect ~10 % boost in average win size.
---
Disclaimer & License
Trading carries risk of loss. Use this script “as is” under the Mozilla Public License 2.0 (mozilla.org). Always backtest, paper-trade, and adjust risk settings to your own profile.
---
Credits & References
- Pine Script v6, using TradingView’s built-in `ta.supertrend()`.
- TradingView House Rules: www.tradingview.com
Goodluck!
BullByte
Cerca negli script per "the script"

Universal Algo [Coff3eG]Universal Algo By G
Overview:
Universal Algo By G is a comprehensive LONG-ONLY trading strategy specifically designed for medium to long-term use in cryptocurrency markets, particularly Bitcoin. This algorithm can be manually adjusted to fit the volatility of specific coins, ensuring the best possible results. While it does not generate a large number of trades due to the nature of bull and bear market cycles, it has been rigorously backtested and forward-tested to ensure the strategy is not overfitted.
Core Features:
Integrated Systems: Universal Algo is built around five core systems, each contributing unique analytical perspectives to enhance trade signal reliability. These systems are designed to identify clear trend opportunities for significant gains while also employing logic to navigate through ranging markets effectively.
Optional Ranging Market Filter: Helps filter out noise, potentially enhancing signal clarity.
Market State Detection: Identifies four distinct market states:
Trending
Ranging
Danger (Possible top)
Possible Bottom
Global Liquidity Indicator (GLI) Integration: Leverages GLI values to identify positive liquidity trends.
Volatility Bands: Provides insights into market volatility.
Top and Bottom Detection: Shows possible bottoms with green backgrounds and red backgrounds for possible top detection.
The Market State Detection, GLI, Volatility Bands, and Top and Bottom Detection feature all serve as an expectation management feature.
Additional Features:
Optional Metrics Table: Displays strategy metrics and statistics, providing detailed insights into performance.
Customization Options: The script offers a range of user inputs, allowing for customization of the backtesting starting date, the decision to display the strategy equity curve, among other settings. These inputs cater to diverse trading needs and preferences, offering users control over their strategy implementation.
Operational Parameters:
Customizable Inputs: Users can adjust thresholds to match the coin's volatility, enhancing strategy performance.
Transparency and Logic Insight: While specific calculation details and proprietary indicators are integral to maintaining the uniqueness of Universal Algo, the strategy is grounded on well-established financial analysis techniques. These include momentum analysis, volatility assessments, and adaptive thresholding, among others, to formulate its trade signals. Notably, no single indicator is used in isolation; each indicator is combined with another to enhance signal accuracy and robustness. Some of the indicators include customized versions of the TEMA, Supertrend, Augmented Dickey-Fuller (ADF), and Weekly Positive Directional Movement Index (WPDM), all integrated together to create a cohesive and effective trading strategy.
System Operation:
Universal Algo works by taking the average score of the five core systems used for the signals. Three of these systems have been lengthened out to function as longer-term systems, while the remaining two operate at a slightly faster speed. This combination and averaging of systems help to balance the overall strategy, ensuring it maintains the right amount of speed to remain effective for medium to long-term use with minimal noise. The average score is then compared against customizable thresholds. The strategy will go long if the average score is above the threshold and short if it is below the threshold. This averaging mechanism helps to smooth out individual system anomalies and provides a more robust signal for trading decisions.
Originality and Usefulness:
Universal Algo is an original strategy that combines multiple proprietary and customized indicators to deliver robust trading signals. The strategy integrates various advanced indicators and methodologies, including:
System Indicator: Calculates a cumulative score based on recent price movements, aiding in trend detection.
Median For Loop: Utilizes percentile rank calculations of price data to gauge market direction.
Volatility Stop: A modified volatility-based stop-loss indicator that adjusts based on market conditions.
Supertrend: A customized supertrend indicator that uses percentile ranks and ATR for trend detection.
RSI and DEMA: Combines a modified RSI and DEMA for overbought/oversold conditions.
TEMA: Uses 3 different types of MA for trend detection and standard deviation bands for additional confirmation.
Detailed Explanation of Components and Their Interaction:
RSI (Relative Strength Index): Used to identify overbought and oversold conditions. In Universal Algo, RSI is combined with DEMA (Double Exponential Moving Average) to smooth the price data and provide clearer signals.
ATR (Average True Range): Used to measure market volatility. ATR is incorporated into the Volatility Stop and Supertrend indicators to adjust stop-loss levels and trend detection based on current market conditions.
DEMA (Double Exponential Moving Average): Provides a smoother price trend compared to traditional moving averages, reducing lag and making it easier to identify trend changes.
Modified TEMA (Triple Exponential Moving Average): Similar to DEMA but provides even greater smoothing, reducing lag further and enhancing trend detection accuracy.
Volatility Stop: Utilizes ATR to dynamically set stop-loss levels that adapt to changing market volatility. This helps in protecting profits and minimizing losses.
Customized Supertrend: Uses ATR and percentile ranks to determine trend direction and strength. This indicator helps in capturing major trends while filtering out market noise.
Median For Loop: Calculates percentile ranks of price data over a specified period to assess market direction. This helps in identifying potential reversals and trend continuations.
HMA (Hull Moving Average): A fast-acting moving average that reduces lag while maintaining smoothness. It helps in quickly identifying trend changes.
SMA (Simple Moving Average): A traditional moving average that provides baseline trend information. Combined with HMA and other indicators, it forms a comprehensive trend detection system.
Universal Algo offers a sophisticated blend of advanced indicators and proprietary logic that is not available in free or open-source scripts. Here are some reasons why it is worth paying for:
Customization and Flexibility: The strategy provides a high degree of customization, allowing users to adjust various parameters to suit their trading style and market conditions. This flexibility is often not available in free scripts.
Proprietary Indicators: The use of proprietary and customized indicators such as the TEMA, Supertrend, ADF, and WPDM ensures that the strategy is unique and not replicable by free or open-source scripts.
Integrated Systems: The strategy combines multiple systems and indicators to provide a more comprehensive and reliable trading signal. This integration helps to smooth out anomalies and reduces noise, providing clearer trading opportunities.
Rigorous Testing: Universal Algo has undergone extensive backtesting and forward-testing to ensure its robustness and reliability. The results demonstrate its ability to perform well under various market conditions, offering users confidence in its effectiveness.
Detailed Metrics and Analysis: The optional metrics table provides users with detailed insights into the strategy's performance, including metrics like equity, drawdown, Sharpe ratio, and more. This level of detail helps traders make informed decisions.
Value Addition: By providing a strategy that combines advanced indicators, customization options, and thorough testing, Universal Algo adds significant value to traders looking for a reliable and adaptable trading tool.
Realistic Trading Conditions:
Backtesting and Forward-Testing: Rigorous testing ensures performance and reliability, with a focus on prudent risk management. Default properties include an initial capital of $1000, 0 pyramiding, 20 slippage, 0.05% commission, and using 5% of equity for trades.
The strategy is designed and tested with a focus on achieving a balance between risk and reward, striving for robustness and reliability rather than unrealistic profitability promises. Realistic trading conditions are considered, including appropriate account size, commission, slippage, and sustainable risk levels per trade.
Concluding Thoughts:
Universal Algo By G is offered to the TradingView community as a robust tool for enhancing market analysis and trading strategies. It is designed with a commitment to quality, innovation, and adaptability, aiming to provide valuable insights and decision support across various market conditions. Potential users are encouraged to evaluate Universal Algo within the context of their overall trading approach and objectives.

Só Trade Top - Média de 8 - Augusto BackesThis strategy is an ADAPTATION of the EMA8 Setup from Augusto Backes (brazilian crypto youtuber).
The strategy was designed to work on the daily timeframe with the weekly EMA8.
Buy signals when there is a bullish candle above the weekly EMA8 - bullish candles in the script: engulfing candles, closing price reversal and bullish hammer.
Exit signals when there is a bearish candle below the weekly EMA8 - bearish candles in script: engulfing candles, closing price reversal and bearish hammer.
Entries and Exits on signals close.
Risk Management: all in on every trade.
The results here shown are from the standard parameters of the strategy.
------------------------------------------------------------------------------------------------------
PORTUGUESE TRANSLATION
------------------------------------------------------------------------------------------------------
Essa estratégia é uma adaptação do setup EMA8 do youtuber crypto Augusto Backes.
A estratégia foi desenvolvida para trabalhar em gráficos diários, usando a EMA8 do gráfico semanal.
Sinais de compra: quando uma figura de alta acontece acima da EMA8 semanal. Figuras de alta consideradas: Engolfo de Alta, Preço de fechamento de reversão de alta e Martelo de Alta
Sinais de saída do trade: quando uma figura de baixa acontece abaixo da EMA8 semanal. Figuras de baixa consideradas: Engolfo de Baixa, Preço de fechamento de reversão de baixa e Martelo de Baixa.
Todas as ordens são executadas dos fechamentos dos candles de sinal.
Gestão de risco: 100% do capital em cada trade.
Os resultados mostrados são com a aplicação dos parâmetros padrão da estratégia.

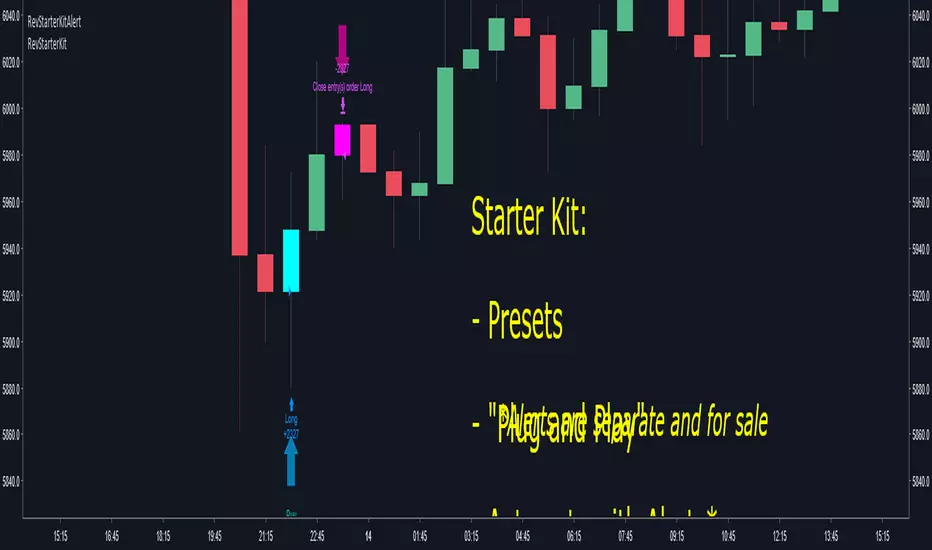
Crypto Reversal Scalper STARTER KIT BacktesterThis is a starter kit for people to try out.
Since many people were confused to how to properly config the original script, I decided to create this script.
This script uses the original script but is compiled to have presets.
Simple to use, EASY AS 1,2,3
1. Choose PAIR
2. Sync chart with chosen pair (Symbol and Timeframe)
3. DONE!
4. (Optional) Adjust Stoploss and Takeprofit
This will be FREE for people to consider giving it a try.
To automate the trades, you will need to have the alerts for the script.
If you want to automate the trades, PM me.
RSI Buy/sell signal with TP_SL_TL_15min by rajistaRSI Buy/sell signal with TakeProfit_Stop loss_Trailing_SL script -can be used on any altcoin/btc pair on the 15min chart .
This script can be used for backtesting pupose and also to give buy/sell signals based on the settings provided by you.
Benefits of the script:
1> Fully customizable script according to your trade setups.
2> The script incorporates Take-profit, Stop-loss & Trailing SL.
3> Cuts your losses significantly, in comparision to a script without TP, SL & TL strategies.
4> Based on RSI Overbought/Oversold levels, which can also be customizable.
5> Doesn't take too many trades in a day, thereby decreasing commission paid to exchanges & hence enhances the overall profit.
Here's how, you can fully customize the script, according to your strategy, once you have been provided access:
( To gain access to the script just hit the like/comment in the #tradingview published article & i'll grant access based on your tradingview userid )
You can add this script to your charts in 15min timeframe, like adding any other simple indicator.
Once you have added the script, just hit the settings button to fully customize the script according to your strategy and plan, that you have, for your trade setup.
Take profit, Stop loss, Trailing Stop loss values can be entered in satoshis from the setting panel.
RSI Overbought & Oversold values can also be entered according to your trading setup.
Like in below example , i have put the following values as default
Test date is set as 1 May 2018
Take profit=1000, stop loss=5, Trailing SL=40
RSI Overbought=70, Oversold=20
" Above mentioned values are default values and may not be profitable in every condition, you have to backtest the strategy by changing these values and then see the results of given values under the Strategy tester tab- located at bottom of your #tradingview chart. "
Lets see how the scipt is able to make these awesome gains:
Suppose your script enters a trade(buys Verge) when #Verge is at 800sats
Then the bot will close the trade(sell Verge) when either of these things happen:
a> Verge surges to 1800 sats, then the script will close trade by Taking profit
b>Verge increases to 850 only, but the RSI value in 15min chart has gone above 70 (Overbought-default value) then scipt will close trade.
c>Verge decreases to 995 sats, then script will close trade by Stop loss hit.
d>Verge surges to 840 but then again drops slightly to 835, script will again close trade by Trailing SL hit.
Initial capital is set to 10 btc
Make sure to check the performance summary tab below and overview of the script running on #XVGBTC since 1 May 2018-Till date
Profit -11.6% while running script
Where Buy and hold return for verge in the same period is:
- to get an instant notification, once i publish a script or a trading analysis/trade-setup , which will always be available for free for everyone!!!

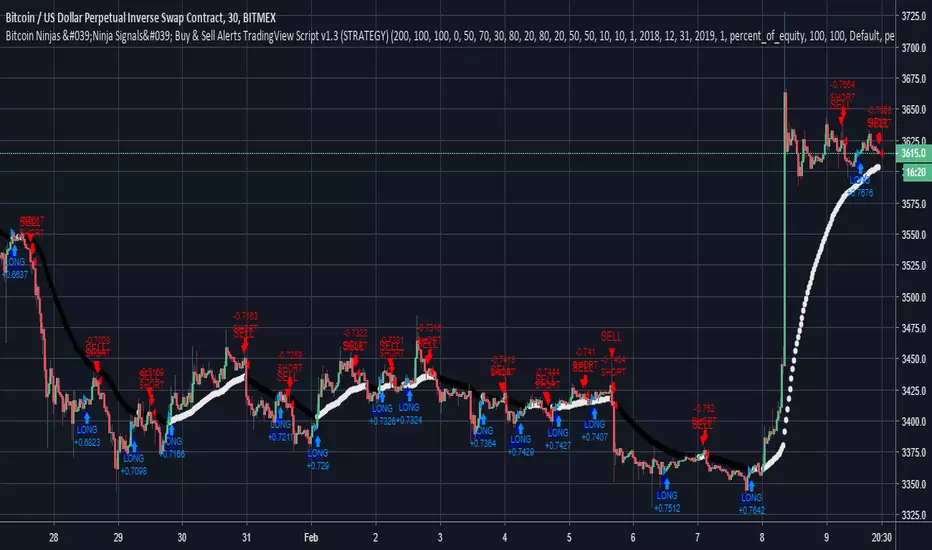
Bitcoin Ninjas 'Ninja Signals' Buy & Sell Alert Trading StrategyBitcoin Ninjas 'Ninja Signals' Buy/Sell Alerts & Backtesting TradingView Script
(for Cryptocurrencies, Forex, GunBot, ProfitTrailer, automatic trading software, and more)
Main Script:
-Allows users to easily set automated buy and sell alerts on TradingView for use with automatic and manual trading of cryptocurrencies, Forex securities, and more (alerts are compatible with automatic trading software such as GunBot, ProfitTrailer, and more).
-Synthesizes many powerful indicators [e.g. Relative Strength Index (RSI), stochastic RSI, Money Flow Index (MFI), Moving Average Convergence Divergence (MACD), etc.) into one super script to generate very precise buy and sell signals in almost any market condition.
-Buy arrows (blue) and sell arrows (red) can be changed or hidden for ease of viewing.
-No lag EMA trendline featuring trend-reversal color-coding (white uptrend, black downtrend).
-Adjustable ‘calibration’ setting allows users to customize the script to work for any currency or security available through TradingView, on any exchange, simply by adjusting a number.
-Complete with backtesting strategy version of script which allows users to test various buy and sell strategies based on the alerts the script generates (see info and screenshots below).
-Backtesting strategy incorporates a user-defined adjustable date range, so users can estimate the script’s performance over specific periods of time, such as the last day, week, or month.
-Backtesting strategy utilizes a minimum protective gain setting to help you never sell for a loss. Simply adjust your minimum profit (%) per trade, and the test results will update.
-Backtesting strategy allows for pyramid buying to test various average down / double up buying strategies. Simply adjust the number of pyramid buys and the quantity of each buy.
-Free 7-day trial available for TradingView users who join our free BitcoinNinjas community.
-Free 24/7 support via BitcoinNinjas Telegram GunBot support group with script purchase.
-Fully compatible with GunBot automatic trading software (TradingView plugin is required).
-Special discount available for traders who purchase GunBot automatic trading software and the GunBot TradingView plugin from BitcoinNinjas, allowing for fully automatic trading.
-Contact us via Email or Telegram for more information, to request additional / custom screenshots, or to start your free trial.
Screenshot (Script)
Screenshot (Backtesting Strategy)
Screenshot (Adjustable Calibration, Minimum Profit Per Trade, & Date Range)
Screenshot (Optional Pyramid / Average Down Buying)
Screenshot (Customizable Buy/Sell Arrows & Trend Reversal Line)
DISCLAIMER: By viewing and/or using this TradingView script, you agree to the BitcoinNinjas 'Terms of Use', as presented on our website ( BitcoinNinjas.org ) and as stated here. No sharing, copying, reselling, modifying, or any other forms of use, are authorized for this document. This document is strictly for individual use and informational purposes only. This is not financial or investment advice. Investments are always made at your own risk, and are based on yo
Liquidity Sweep & FVG StrategyThis strategy combines higher-timeframe liquidity levels, stop-hunt (sweep) logic, Fair Value Gaps (FVGs) and structure-based take-profits into a single execution engine.
It is not a simple mash-up of indicators: every module (HTF levels, sweeps, FVGs, ZigZag, sessions) feeds the same entry/exit logic.
1. Core Idea
The script looks for situations where price:
Sweeps a higher-timeframe high/low (takes liquidity around obvious levels),
Then forms a displacement candle with a gap (FVG) in the opposite direction,
Then uses the edge of that FVG as a limit entry,
And manages exits using unswept structural levels (ZigZag swings or HTF levels) as targets.
The intent is to systematically trade failed breakouts / stop hunts with a defined structure and risk model.
It is a backtesting / study tool, not a signal service.
2. How the Logic Works (Conceptual)
a) Higher-Timeframe Liquidity Engine
Daily, Weekly and Monthly highs/lows are pulled via request.security() and stored as HTF liquidity levels.
Each level is drawn as a line with optional label (1D/1W/1M High/Low).
A level is marked as “swept” once price trades through it; swept levels may be removed or shortened depending on settings.
b) Sweep & Manipulation Filter
A low sweep occurs when the current low trades through a stored HTF low.
A high sweep occurs when the current high trades through a stored HTF high.
If both a high and a low are swept in the same bar, the script flags this as “manipulation” and blocks new entries around that noise.
The script also tracks the sweep wick, bar index and HTF timeframe for later use in SL placement and labels.
c) FVG Detection & Management
FVGs are defined using a 3-candle displacement model:
Bullish FVG: high < low
Bearish FVG: low > high
Only gaps larger than a minimum size (ATR-based if no manual value is set) are kept.
FVGs are stored in arrays as boxes with: top, bottom, mid (CE), direction, and state (filled / reclaimed).
Boxes are auto-extended and visually faded when price is far away, or deleted when filled.
d) Entry Conditions (Sweep + FVG)
For each recent sweep window:
After a low sweep, the script searches for the nearest bullish FVG below price and uses its top edge as a long limit entry.
After a high sweep, it searches for the nearest bearish FVG above price and uses its bottom edge as a short limit entry.
A “knife protection” check blocks trades where price is already trading through the proposed stop.
Only one entry per sweep is allowed; entries are only placed inside the configured NY trading sessions and only if no manipulation flag is active and EOD protection allows it.
e) Stop-Loss Placement (“Tick-Free” SL)
The stop is not placed directly on the HTF level; instead, the script scans a window around the sweep bar to find a local extreme:
Longs: lowest low in a configurable bar window around the sweep.
Shorts: highest high in that window.
This produces a structure-based SL that is generally outside the main sweep wick.
f) Take-Profit Logic (ZigZag + HTF Levels)
A lightweight ZigZag engine tracks swing highs/lows and removes levels that have already been broken.
For intraday timeframes (< 1h), TP candidates come from unswept ZigZag swings above/below the entry.
For higher timeframes (≥ 1h), TP candidates fall back to unswept HTF liquidity levels.
The script picks up to two targets:
TP1: nearest valid target in the trade direction (or a 2R fallback if none exists),
TP2: second target (or a 4R fallback if none exists).
A multi-TP model is used: typically 50% at TP1, remainder managed towards TP2 with breakeven plus offset once TP1 is hit.
g) Session & End-of-Day Filters
Three predefined NY sessions (Early, Open, Afternoon) are available; entries are only allowed inside active sessions.
An End-of-Day filter checks a user-defined NY close time and:
Blocks new entries close to the end of the day,
Optionally forces flat before the close.
3. Inputs Overview (Conceptual)
Liquidity settings: which HTF levels to track (1D/1W/1M), how many to show, and sweep priority (highest TF vs nearest vs any).
FVG settings: visibility radius, search window after a sweep, minimum FVG size.
ZigZag settings: swing length used for TP discovery.
Execution & protection: limit order timeout, breakeven offset, EOD protection.
Visuals: labels, sweep markers, manipulation warning, session highlighting, TP lines, etc.
For exact meaning of each input, please refer to the inline comments in the open-source code.
4. Strategy Properties & Backtesting Notes
Default strategy properties in this script:
Initial capital: 100,000
Order size: 10% of equity (strategy.percent_of_equity)
Commission: 0.01% per trade (adjust as needed for your broker/asset)
Slippage: must be set manually in the Strategy Tester (recommended: at least a few ticks on fast markets).
Even though the order size is 10% of equity, actual risk per trade depends on the SL distance and is typically much lower than 10% of the account. You should still adjust these values to keep risk within what you personally consider sustainable (e.g. somewhere in the 1–2% range per trade).
For more meaningful results:
Test on liquid instruments (e.g. major indices, FX, or liquid futures).
Use enough history to reach 100+ closed trades on your market/timeframe.
Always include realistic commission and slippage.
Do not assume that past performance will continue.
5. How to Use
Apply the strategy to your preferred symbol and timeframe.
Set broker-like commission and slippage in the Strategy Tester.
Adjust:
HTF levels (1D/1W/1M),
Sessions (NY windows),
FVG search window and minimum size,
ZigZag length and EOD filter.
Observe how entries only appear:
After a HTF sweep,
In the configured session,
At a FVG edge,
With TP lines anchored at unswept structure / liquidity.
Use this primarily as a research and backtesting tool to study how your own ICT / SMC ideas behave over a large sample of trades.
6. Disclaimer
This script is for educational and research purposes only.
It does not constitute financial advice, and it does not guarantee profitability. Always validate results with realistic assumptions and use your own judgment before trading live.

TSI.LTA | Base BTC 1DTSI.LTA | Base BTC 1D is a closed‑source trend‑following strategy designed for BTC on the 1D timeframe .
It focuses on participating in the main directional moves of the market while avoiding as much short‑term noise as possible.
📊 The script:
Uses a combination of moving‑average–based filters and volatility bands to define the active trend.
Applies optional volume filters to avoid low‑participation or exhausted moves.
Includes risk‑management controls (Stop Loss, Take Profit, Trailing Stop) that work on a per‑trade basis.
All entries and exits are confirmed at bar close and the script does not repaint .
This makes it suitable for backtesting, alerts and external automation.
█ 💡 CONCEPTS
This strategy is built around a few simple ideas:
1 — Trend first.
Positions are only taken when a group of smoothed trend filters agree on direction.
The goal is to ride larger swings, not to scalp each fluctuation.
2 — Volatility awareness.
Standard‑deviation–based bands help avoid entries in abnormal spikes or during very compressed ranges.
3 — Participation filter.
Optional volume‑based conditions (VWMA, OBV slope, MFI, volume Z‑score) try to ensure that entries occur when the market shows enough activity, not during dead phases.
4 — Risk defined in advance.
Stop‑loss and trailing‑stop inputs are expressed as percentages relative to entry price, so users can align them with their own risk tolerance.
The logic is purposely conservative: it is expected to stay flat during parts of the market where the trend is unclear or participation is weak.
█ ⚙️ FEATURES & INPUTS
This section follows approximately the order of the script’s inputs, so users can read here and then match what they see in the “Inputs” tab.
1 — 📐 Trend filters
These inputs control how the strategy detects the underlying trend:
DEMA / Gaussian / SMMA lengths
Control how fast or slow the trend reacts to price changes.
Shorter lengths → more responsive, more trades, more noise.
Longer lengths → slower reaction, fewer trades, more filtering.
Volatility Bands (SD length & multipliers)
Standard‑deviation bands around the smoothed price series.
They are used to avoid entries during extreme moves or very narrow ranges where a breakout is not yet confirmed.
In practice, these settings let the user choose between a more “aggressive” trend follower (shorter lengths, smaller bands) or a more “patient” one.
2 — 📊 Volume filters (optional)
These filters are meant to restrict trades to periods where the market shows meaningful participation:
VWMA filter
Requires price to be aligned with a Volume‑Weighted Moving Average, which de‑emphasizes moves on very low volume.
OBV slope filter
Uses the slope of On‑Balance Volume to check that net volume flow supports the direction of the trade.
MFI band filter
Uses the Money Flow Index to avoid taking new entries in zones that often correspond to exhaustion (extreme values defined by the user).
Volume Z‑Score
Compares current volume to its recent history. Trades can be restricted when volume is unusually low or out of character for that period.
When any of these filters are turned off, the strategy relies only on price‑based trend and volatility logic.
When they are on, trades are more selective and may be fewer.
3 — 🛡️ Risk management
These inputs define how individual trades are managed once entered.
They do not change the trend logic itself:
Stop Loss (%)
A percentage move against the entry price that will close the position.
Typical values on BTC 1D remain in the single‑digit range so that no single trade risks an unrealistic portion of equity.
Take Profit (%)
An optional fixed target that closes the trade when price has moved a chosen percentage in favor.
This can be disabled if the user prefers to let the trend filters perform the exit.
Trailing Stop (%)
A stop that follows the most favorable price reached since entry.
When the “use lower timeframe peak” option is enabled, peaks can be detected on a lower timeframe for more granular trailing, while decisions still occur at the close of the 1D bar.
Fixed SL/TP Price and Activation Date
Allow defining absolute price levels and a date from which they start applying.
This is useful when the user wants structural protection around known price zones.
The combination of these controls determines how deep a pullback the user is willing to tolerate and how much profit they are prepared to give back in order to stay in trends.
4 — 🚫 Filter failure & cooldown
To avoid over‑trading in difficult environments, the script can:
Automatically exit when filters remain unfavorable for a configurable number of bars.
Enter a cooldown period, during which no new trades are taken, even if some conditions improve.
These mechanisms are intended to protect capital during choppy or low‑quality phases rather than force constant exposure.
█ 📚 HOW TO USE
A suggested process for using this strategy as a study tool:
1 — Start on BTC 1D.
Apply the script to BTCUSD or BTC/USDT on the 1D timeframe, with default inputs.
2 — Open the Strategy Tester.
Choose a time window (for example a full halving cycle, a crash + recovery period, or just the most recent bull leg).
3 — Compare with Buy & Hold.
For the same window, look at:
Net profit of the strategy vs Buy & Hold.
Max drawdown of the strategy vs Buy & Hold.
The goal is not to hit a particular number, but to see whether, in that window, the strategy manages to:
Provide a smoother equity curve (lower drawdown),
While still performing at least as well as, or better than, simply holding the asset.
4 — Experiment with risk inputs.
Vary Stop Loss, Trailing Stop and the volume filters.
After each change, re‑check the same two questions above. This should make clear how each input affects the trade‑off between participation and risk.
5 — Forward‑test.
Before using any configuration with real capital, let it run for a while in paper‑trading or demo conditions.
█ 🚧 LIMITATIONS
The strategy is built and tuned primarily for BTC on 1D.
It can be used on other symbols and timeframes, but behavior may differ and requires new testing.
In very tight ranges or during event‑driven gaps, trend logic may enter later than discretionary trading would. This is expected for a conservative trend‑following approach.
Results from historical backtests depend on data quality, broker settings, fees and slippage configured in the Strategy Tester.
█ 📝 NOTES
Signals are generated on bar close.
The script is closed‑source, but the description explains the main ideas so users and moderators can understand what it does and how to use it.
The HUD on the chart is meant as a compact summary of the same statistics available in the Strategy Tester; it simply makes comparisons quicker.
█ ⚠️ DISCLAIMER
This strategy is provided for educational and research purposes only .
It is not financial advice and does not recommend any specific trades, assets, position sizes, or risk levels.
Users are fully responsible for:
Choosing their own risk parameters (Stop Loss, Take Profit, Trailing Stop, position sizing, etc.).
Testing the script on the markets and timeframes they intend to trade.
Verifying that any configuration is appropriate for their capital, risk tolerance and jurisdiction.
Past performance in backtests or examples does not guarantee future results.
Always test carefully before considering any live deployment.

Pro Reversal Strategie - FinalCore Functionality Description
The "Pro Reversal Strategy" script is a comprehensive and highly customizable trading system for TradingView. Its core idea is based on a mean-reversion strategy, which aims to capitalize on price extremes where the price is likely to revert to its statistical mean. This script ist full AI generated. There ist no support and no financial advice.
To identify entry points, the script combines classic indicators like the RSI (to detect overbought and oversold conditions) and Bollinger Bands (to measure volatility extremes).
However, the script's strength lies in its confluence logic: a simple RSI or Bollinger Band signal is not enough to trigger a trade. Instead, a series of filters are applied to enhance the quality of the trade signals. These include:
Trend Filter: Trades are only taken in the direction of the higher-level trend (defined by a 200-period Moving Average).
Volatility and Volume Filter: ADX and volume analysis ensure that the market has sufficient momentum for a move.
Market Structure Analysis: Concepts like Fair Value Gaps (FVG), liquidity zones, and the Volume Profile (VRVP/POC) are used to place trades in high-probability zones.
Momentum Filter: Special "Vector Candles" confirm the strength of buyers or sellers at the moment of the signal.
Furthermore, the script offers advanced features for risk and trade management, including automatic position sizing based on a percentage risk and dynamic exit strategies like a breakeven stop and a trailing stop-loss (Chandelier ATR).
A detailed info panel visualizes all key metrics in real-time directly on the chart. Thanks to its versatile configuration options, the script can be adapted for various trading styles, including swing trading, day trading, and scalping.
Core Strategies & Filters (English)
Here is a breakdown of the specific strategies and confirmation filters used within the script:
RSI Mean Reversion: Uses the Relative Strength Index (RSI) to identify overbought (> rsiSellShort) and oversold (< rsiBuyLong) conditions, which serve as the primary trigger for a potential price reversal.
Bollinger Bands (BB) Volatility Filter: Trades are confirmed when the price touches or exceeds the outer Bollinger Bands. This indicates a move to a statistical extreme in terms of volatility, reinforcing the reversal thesis.
Trend Filter (200 SMA): Ensures that long trades are only considered in a general uptrend (price > SMA 200) and short trades in a downtrend (price < SMA 200), preventing trades against the dominant market direction.
ADX Trend Strength Filter: Utilizes the Average Directional Index (ADX) to confirm that a market is trending with sufficient strength. Trades are filtered out during weak or non-trending phases (adx < adxThreshold).
Volume Profile (VRVP / POC): Analyzes volume at specific price levels to identify high-volume nodes (Point of Control - POC). This acts as a filter to avoid entering trades directly into a zone of strong support or resistance.
Vector Candle Filter: Identifies "Vector Candles" – large, high-volume candles that close strongly near their high (bullish) or low (bearish). This custom filter confirms strong conviction behind the initial reversal signal.
Market Structure (FVG & Liquidity): Incorporates advanced price action concepts. It looks for entries after a liquidity zone above a previous high/low has been tapped (Liquidity Grab) or when price enters a Fair Value Gap (FVG), adding a layer of institutional trading logic.
Chart Pattern Recognition: Optionally identifies classic chart patterns like "W-Patterns" (Double Bottom), "M-Patterns" (Double Top), and Ascending Triangles to provide additional visual confirmation for traders.
Position Sizing (Risk %): Automatically calculates the trade size based on a user-defined percentage of the total equity (riskPct) and the distance to the stop-loss, ensuring consistent risk management for every trade.
Dynamic Exit Management: Implements advanced exit strategies beyond a fixed take-profit. This includes moving the stop-loss to Breakeven after a certain risk-to-reward ratio is met and using a Trailing Stop-Loss (e.g., Chandelier ATR) to lock in profits as a trade develops.

SwingTrade VWAP Strategy[TiamatCrypto]V1.1This Pine Script® code creates a trading strategy called "SwingTrade VWAP Strategy V1.1." This strategy incorporates various trading tools, such as VWAP (Volume Weighted Average Price), ADX (Average Directional Index), and volume signals. Below is an explanation of the components and logic within the script:
### Overview of Features
- **VWAP:** A volume-weighted moving average that assesses price trends relative to the VWAP level.
- **ADX:** A trend strength indicator that helps confirm the strength of bullish or bearish trends.
- **Volume Analysis:** Leverages volume data to gauge momentum and identify volume-weighted buy/sell conditions.
- **Dynamic Entry/Exit Signals:** Combines the above indicators to produce actionable buy/sell or exit signals.
- **Customizable Inputs:** Inputs for tuning parameters like VWAP period, ADX thresholds, and volume sensitivity.
---
### **Code Breakdown**
#### **Input Parameters**
The script begins by defining several user-configurable variables under groups. These include indicators' on/off switches (`showVWAP`, `enableADX`, `enableVolume`) and input parameters for VWAP, ADX thresholds, and volume sensitivity:
- **VWAP Period and Threshold:** Controls sensitivity for VWAP signal generation.
- **ADX Settings:** Allows users to configure the ADX period and strength threshold.
- **Volume Ratio:** Detects bullish/bearish conditions based on relative volume patterns.
---
#### **VWAP Calculation**
The script calculates VWAP using the formula:
\
Where `P` is the typical price (`(high + low + close)/3`) and `V` is the volume.
- It resets cumulative values (`sumPV` and `sumV`) at the start of each day.
- Delta percentage (`deltaPercent`) is calculated as the percentage difference between the close price and the VWAP.
---
#### **Indicators and Signals**
1. **VWAP Trend Signals:**
- Identifies bullish/bearish conditions based on price movement (`aboveVWAP`, `belowVWAP`) and whether the price is crossing the VWAP level (`crossingUp`, `crossingDown`).
- Also detects rising/falling delta changes based on the VWAP threshold.
2. **ADX Calculation:**
- Calculates the directional movement (`PlusDM`, `MinusDM`) and smoothed values for `PlusDI`, `MinusDI`, and `ADX`.
- Confirms strong bullish/bearish trends when ADX crosses the defined threshold.
3. **Volume-Based Signals:**
- Evaluates the ratio of bullish volume (when `close > VWAP`) to bearish volume (when `close < VWAP`) over a specified lookback period.
---
#### **Trade Signals**
The buy and sell signals are determined by combining conditions from the VWAP, ADX, and volume signals:
- **Buy Signal:** Triggered when price upward crossover VWAP, delta rises above the threshold, ADX indicates a strong bullish trend, and volume confirms bullish momentum.
- **Sell Signal:** Triggered under inverse conditions.
- Additionally, exit conditions (`exitLong` and `exitShort`) are based on VWAP crossovers combined with the reversal of delta values.
---
#### **Plotting and Display**
The strategy plots VWAP on the chart and adds signal markers for:
- **Buy/Long Entry:** Green triangle below bars.
- **Sell/Short Entry:** Red triangle above bars.
- **Exit Signals:** Lime or orange "X" shapes for exits from long/short positions.
- Additionally, optional text labels are displayed to indicate the type of signal.
---
#### **Trading Logic**
The script's trading logic executes as follows:
- **Entries:**
- Executes long trades when the `buySignal` condition is true.
- Executes short trades when the `sellSignal` condition is true.
- **Exits:**
- Closes long positions upon `exitLong` conditions.
- Closes short positions upon `exitShort` conditions.
- The strategy calculates profits and visualizes the trade entry, exit, and running profit within the chart.
---
#### **Alerts**
Alerts are set up to notify traders via custom signals for buy and sell trades.
---
### **Use Case**
This script is suitable for day traders, swing traders, or algorithmic traders who rely on confluence signals from VWAP, ADX, and volume momentum. Its modular structure (e.g., the ability to enable/disable specific indicators) makes it highly customizable for various trading styles and financial instruments.
#### **Customizability**
- Adjust VWAP, ADX, and volume sensitivity levels to fit unique market conditions or asset classes.
- Turn off specific criteria to focus only on VWAP or ADX signals if desired.
#### **Caution**
As with all trading strategies, this script should be used for backtesting and analysis before live implementation. It's essential to validate its performance on historical data while considering factors like slippage and transaction costs.

GRASS Purple Cloud [MMD] MTFThis Pine Script code is a trading strategy designed for use on the TradingView platform. It implements a multi-timeframe (MTF) strategy called "GRASS Purple Cloud " that utilizes various technical indicators to generate buy and sell signals. Below is a breakdown of the key components of the script:
Key Components of the Strategy
Inputs:
HTF (Higher Time Frame): Allows the user to select a higher time frame for analysis.
ATR and Supertrend Parameters: Inputs for the Average True Range (ATR) and Supertrend indicator, which are used to determine market volatility and trend direction.
Buying and Selling Pressure Thresholds: These thresholds help define conditions for entering trades based on buying and selling pressure.
Backtest Date Range: Users can specify a date range for backtesting the strategy.
HTF Logic:
The htfLogic function calculates various values based on the selected higher time frame, including buying and selling conditions, which are then used to generate signals.
Signal State Tracking:
The script tracks the state of buy and sell signals using a variable xs, which changes based on the conditions defined in the htfLogic function.
Coloring and Labels:
The bars on the chart are colored green for buy signals and red for sell signals. Additionally, labels are plotted to indicate strong buy and sell signals.
EMA Plotting:
The script includes optional plotting of Exponential Moving Averages (EMAs) for 20, 50, and 200 periods, which can help traders identify trends.
Trade Management:
The strategy includes parameters for take profit (TP) and stop loss (SL) levels, allowing for risk management. The user can specify the percentage for TP and SL, as well as the number of units to sell at each level.
Entries and Exits:
The script defines conditions for entering long and short positions based on the buy and sell signals. It also manages exits based on TP and SL levels.
Trendline Logic:
The script identifies the last two significant highs to draw a trendline, which can help visualize market structure.
TP/SL Plotting:
The script plots the TP and SL levels on the chart for visual reference.
Reset After Exit:
After a trade is closed, the script resets the relevant variables to prepare for the next trade.
Usage
To use this strategy:
Adjust the input parameters as needed for your trading preferences.
Add the strategy to a chart to visualize the signals and performance.
Considerations
As with any trading strategy, it's essential to backtest and validate the performance over historical data before using it in live trading.
Market conditions can change, and past performance is not indicative of future results. Always use risk management practices when trading.

Kernel Regression Envelope with SMI OscillatorThis script combines the predictive capabilities of the **Nadaraya-Watson estimator**, implemented by the esteemed jdehorty (credit to him for his excellent work on the `KernelFunctions` library and the original Nadaraya-Watson Envelope indicator), with the confirmation strength of the **Stochastic Momentum Index (SMI)** to create a dynamic trend reversal strategy. The core idea is to identify potential overbought and oversold conditions using the Nadaraya-Watson Envelope and then confirm these signals with the SMI before entering a trade.
**Understanding the Nadaraya-Watson Envelope:**
The Nadaraya-Watson estimator is a non-parametric regression technique that essentially calculates a weighted average of past price data to estimate the current underlying trend. Unlike simple moving averages that give equal weight to all past data within a defined period, the Nadaraya-Watson estimator uses a **kernel function** (in this case, the Rational Quadratic Kernel) to assign weights. The key parameters influencing this estimation are:
* **Lookback Window (h):** This determines how many historical bars are considered for the estimation. A larger window results in a smoother estimation, while a smaller window makes it more reactive to recent price changes.
* **Relative Weighting (alpha):** This parameter controls the influence of different time frames in the estimation. Lower values emphasize longer-term price action, while higher values make the estimator more sensitive to shorter-term movements.
* **Start Regression at Bar (x\_0):** This allows you to exclude the potentially volatile initial bars of a chart from the calculation, leading to a more stable estimation.
The script calculates the Nadaraya-Watson estimation for the closing price (`yhat_close`), as well as the highs (`yhat_high`) and lows (`yhat_low`). The `yhat_close` is then used as the central trend line.
**Dynamic Envelope Bands with ATR:**
To identify potential entry and exit points around the Nadaraya-Watson estimation, the script uses **Average True Range (ATR)** to create dynamic envelope bands. ATR measures the volatility of the price. By multiplying the ATR by different factors (`nearFactor` and `farFactor`), we create multiple bands:
* **Near Bands:** These are closer to the Nadaraya-Watson estimation and are intended to identify potential immediate overbought or oversold zones.
* **Far Bands:** These are further away and can act as potential take-profit or stop-loss levels, representing more extreme price extensions.
The script calculates both near and far upper and lower bands, as well as an average between the near and far bands. This provides a nuanced view of potential support and resistance levels around the estimated trend.
**Confirming Reversals with the Stochastic Momentum Index (SMI):**
While the Nadaraya-Watson Envelope identifies potential overextended conditions, the **Stochastic Momentum Index (SMI)** is used to confirm a potential trend reversal. The SMI, unlike a traditional stochastic oscillator, oscillates around a zero line. It measures the location of the current closing price relative to the median of the high/low range over a specified period.
The script calculates the SMI on a **higher timeframe** (defined by the "Timeframe" input) to gain a broader perspective on the market momentum. This helps to filter out potential whipsaws and false signals that might occur on the current chart's timeframe. The SMI calculation involves:
* **%K Length:** The lookback period for calculating the highest high and lowest low.
* **%D Length:** The period for smoothing the relative range.
* **EMA Length:** The period for smoothing the SMI itself.
The script uses a double EMA for smoothing within the SMI calculation for added smoothness.
**How the Indicators Work Together in the Strategy:**
The strategy enters a long position when:
1. The closing price crosses below the **near lower band** of the Nadaraya-Watson Envelope, suggesting a potential oversold condition.
2. The SMI crosses above its EMA, indicating positive momentum.
3. The SMI value is below -50, further supporting the oversold idea on the higher timeframe.
Conversely, the strategy enters a short position when:
1. The closing price crosses above the **near upper band** of the Nadaraya-Watson Envelope, suggesting a potential overbought condition.
2. The SMI crosses below its EMA, indicating negative momentum.
3. The SMI value is above 50, further supporting the overbought idea on the higher timeframe.
Trades are closed when the price crosses the **far band** in the opposite direction of the trade. A stop-loss is also implemented based on a fixed value.
**In essence:** The Nadaraya-Watson Envelope identifies areas where the price might be deviating significantly from its estimated trend. The SMI, calculated on a higher timeframe, then acts as a confirmation signal, suggesting that the momentum is shifting in the direction of a potential reversal. The ATR-based bands provide dynamic entry and exit points based on the current volatility.
**How to Use the Script:**
1. **Apply the script to your chart.**
2. **Adjust the "Kernel Settings":**
* **Lookback Window (h):** Experiment with different values to find the smoothness that best suits the asset and timeframe you are trading. Lower values make the envelope more reactive, while higher values make it smoother.
* **Relative Weighting (alpha):** Adjust to control the influence of different timeframes on the Nadaraya-Watson estimation.
* **Start Regression at Bar (x\_0):** Increase this value if you want to exclude the initial, potentially volatile, bars from the calculation.
* **Stoploss:** Set your desired stop-loss value.
3. **Adjust the "SMI" settings:**
* **%K Length, %D Length, EMA Length:** These parameters control the sensitivity and smoothness of the SMI. Experiment to find settings that work well for your trading style.
* **Timeframe:** Select the higher timeframe you want to use for SMI confirmation.
4. **Adjust the "ATR Length" and "Near/Far ATR Factor":** These settings control the width and sensitivity of the envelope bands. Smaller ATR lengths make the bands more reactive to recent volatility.
5. **Customize the "Color Settings"** to your preference.
6. **Observe the plots:**
* The **Nadaraya-Watson Estimation (yhat)** line represents the estimated underlying trend.
* The **near and far upper and lower bands** visualize potential overbought and oversold zones based on the ATR.
* The **fill areas** highlight the regions between the near and far bands.
7. **Look for entry signals:** A long entry is considered when the price touches or crosses below the lower near band and the SMI confirms upward momentum. A short entry is considered when the price touches or crosses above the upper near band and the SMI confirms downward momentum.
8. **Manage your trades:** The script provides exit signals when the price crosses the far band. The fixed stop-loss will also close trades if the price moves against your position.
**Justification for Combining Nadaraya-Watson Envelope and SMI:**
The combination of the Nadaraya-Watson Envelope and the SMI provides a more robust approach to identifying potential trend reversals compared to using either indicator in isolation. The Nadaraya-Watson Envelope excels at identifying potential areas where the price is overextended relative to its recent history. However, relying solely on the envelope can lead to false signals, especially in choppy or volatile markets. By incorporating the SMI as a confirmation tool, we add a momentum filter that helps to validate the potential reversals signaled by the envelope. The higher timeframe SMI further helps to filter out noise and focus on more significant shifts in momentum. The ATR-based bands add a dynamic element to the entry and exit points, adapting to the current market volatility. This mashup aims to leverage the strengths of each indicator to create a more reliable trading strategy.

Table to filter trades per dayThis script contains a block of code that allows users to filter the total number of trades, loss trades, win trades and win rate per day in a table. This makes it easier to compare which days were profitable and which were not.
Be aware that this script can only be used in strategy scripts. To use the script, open it and copy every line from "START" to "STOP". Then, paste these lines at the very bottom of the strategy script that you want to attach it to.
The user has the ability to adjust the position of the table and customize the size of the text displayed.
If the user sets "Check when the trade:" to "Opened", the script will monitor when the trade opens and add it to the table once it has been closed. If "Check when the trade:" is set to "Closed", the script will track when the trade is closed and add it to the table once it has been closed.
It is recommended to run the script on the "Exchange" setting for more accurate results, even though a "Set the timezone" option is available. This will prevent discrepancies caused by daylight saving time changes.
Please note that the code will only work properly if you choose a daily timeframe or lower.

JS-TechTrading: VWAP Momentum_Pullback StrategyGeneral Description and Unique Features of this Script
Introducing the VWAP Momentum-Pullback Strategy (long-only) that offers several unique features:
1. Our script/strategy utilizes Mark Minervini's Trend-Template as a qualifier for identifying stocks and other financial securities in confirmed uptrends.
NOTE: In this basic version of the script, the Trend-Template has to be used as a separate indicator on TradingView (Public Trend-Template indicators are available on TradingView – community scripts). It is recommended to only execute buy signals in case the stock or financial security is in a stage 2 uptrend, which means that the criteria of the trend-template are fulfilled.
2. Our strategy is based on the supply/demand balance in the market, making it timeless and effective across all timeframes. Whether you are day trading using 1- or 5-min charts or swing-trading using daily charts, this strategy can be applied and works very well.
3. We have also integrated technical indicators such as the RSI and the MA / VWAP crossover into this strategy to identify low-risk pullback entries in the context of confirmed uptrends. By doing so, the risk profile of this strategy and drawdowns are being reduced to an absolute minimum.
Minervini’s Trend-Template and the ‘Stage-Analysis’ of the Markets
This strategy is a so-called 'long-only' strategy. This means that we only take long positions, short positions are not considered.
The best market environment for such strategies are periods of stable upward trends in the so-called stage 2 - uptrend.
In stable upward trends, we increase our market exposure and risk.
In sideways markets and downward trends or bear markets, we reduce our exposure very quickly or go 100% to cash and wait for the markets to recover and improve. This allows us to avoid major losses and drawdowns.
This simple rule gives us a significant advantage over most undisciplined traders and amateurs!
'The Trend is your Friend'. This is a very old but true quote.
What's behind it???
• 98% of stocks made their biggest gains in a Phase 2 upward trend.
• If a stock is in a stable uptrend, this is evidence that larger institutions are buying the stock sustainably.
• By focusing on stocks that are in a stable uptrend, the chances of profit are significantly increased.
• In a stable uptrend, investors know exactly what to expect from further price developments. This makes it possible to locate low-risk entry points.
The goal is not to buy at the lowest price – the goal is to buy at the right price!
Each stock goes through the same maturity cycle – it starts at stage 1 and ends at stage 4
Stage 1 – Neglect Phase – Consolidation
Stage 2 – Progressive Phase – Accumulation
Stage 3 – Topping Phase – Distribution
Stage 4 – Downtrend – Capitulation
This strategy focuses on identifying stocks in confirmed stage 2 uptrends. This in itself gives us an advantage over long-term investors and less professional traders.
By focusing on stocks in a stage 2 uptrend, we avoid losses in downtrends (stage 4) or less profitable consolidation phases (stages 1 and 3). We are fully invested and put our money to work for us, and we are fully invested when stocks are in their stage 2 uptrends.
But how can we use technical chart analysis to find stocks that are in a stable stage 2 uptrend?
Mark Minervini has developed the so-called 'trend template' for this purpose. This is an essential part of our JS-TechTrading pullback strategy. For our watchlists, only those individual values that meet the tough requirements of Minervini's trend template are eligible.
The Trend Template
• 200d MA increasing over a period of at least 1 month, better 4-5 months or longer
• 150d MA above 200d MA
• 50d MA above 150d MA and 200d MA
• Course above 50d MA, 150d MA and 200d MA
• Ideally, the 50d MA is increasing over at least 1 month
• Price at least 25% above the 52w low
• Price within 25% of 52w high
• High relative strength according to IBD.
NOTE: In this basic version of the script, the Trend-Template has to be used as a separate indicator on TradingView (Public Trend-Template indicators are available in TradingView – community scripts). It is recommended to only execute buy signals in case the stock or financial security is in a stage 2 uptrend, which means that the criteria of the trend-template are fulfilled.
This strategy can be applied to all timeframes from 5 min to daily.
The VWAP Momentum-Pullback Strateg y
For the JS-TechTrading VWAP Momentum-Pullback Strategy, only stocks and other financial instruments that meet the selected criteria of Mark Minervini's trend template are recommended for algorithmic trading with this startegy.
A further prerequisite for generating a buy signals is that the individual value is in a short-term oversold state (RSI).
When the selling pressure is over and the continuation of the uptrend can be confirmed by the MA / VWAP crossover after reaching a price low, a buy signal is issued by this strategy.
Stop-loss limits and profit targets can be set variably.
Relative Strength Index (RSI)
The Relative Strength Index (RSI) is a technical indicator developed by Welles Wilder in 1978. The RSI is used to perform a market value analysis and identify the strength of a trend as well as overbought and oversold conditions. The indicator is calculated on a scale from 0 to 100 and shows how much an asset has risen or fallen relative to its own price in recent periods.
The RSI is calculated as the ratio of average profits to average losses over a certain period of time. A high value of the RSI indicates an overbought situation, while a low value indicates an oversold situation. Typically, a value > 70 is considered an overbought threshold and a value < 30 is considered an oversold threshold. A value above 70 signals that a single value may be overvalued and a decrease in price is likely , while a value below 30 signals that a single value may be undervalued and an increase in price is likely.
For example, let's say you're watching a stock XYZ. After a prolonged falling movement, the RSI value of this stock has fallen to 26. This means that the stock is oversold and that it is time for a potential recovery. Therefore, a trader might decide to buy this stock in the hope that it will rise again soon.
The MA / VWAP Crossover Trading Strategy
This strategy combines two popular technical indicators: the Moving Average (MA) and the Volume Weighted Average Price (VWAP). The MA VWAP crossover strategy is used to identify potential trend reversals and entry/exit points in the market.
The VWAP is calculated by taking the average price of an asset for a given period, weighted by the volume traded at each price level. The MA, on the other hand, is calculated by taking the average price of an asset over a specified number of periods. When the MA crosses above the VWAP, it suggests that buying pressure is increasing, and it may be a good time to enter a long position. When the MA crosses below the VWAP, it suggests that selling pressure is increasing, and it may be a good time to exit a long position or enter a short position.
Traders typically use the MA VWAP crossover strategy in conjunction with other technical indicators and fundamental analysis to make more informed trading decisions. As with any trading strategy, it is important to carefully consider the risks and potential rewards before making any trades.
This strategy is applicable to all timeframes and the relevant parameters for the underlying indicators (RSI and MA/VWAP) can be adjusted and optimized as needed.
Backtesting
Backtesting gives outstanding results on all timeframes and drawdowns can be reduced to a minimum level. In this example, the hourly chart for MCFT has been used.
Settings for backtesting are:
- Period from April 2020 until April 2021 (1 yr)
- Starting capital 100k USD
- Position size = 25% of equity
- 0.01% commission = USD 2.50.- per Trade
- Slippage = 2 ticks
Other comments
• This strategy has been designed to identify the most promising, highest probability entries and trades for each stock or other financial security.
• The RSI qualifier is highly selective and filters out the most promising swing-trading entries. As a result, you will normally only find a low number of trades for each stock or other financial security per year in case you apply this strategy for the daily charts. Shorter timeframes will result in a higher number of trades / year.
• As a result, traders need to apply this strategy for a full watchlist rather than just one financial security.

MACD with Support and Resistance - Signals, Alerts, TP and SLMACD with Support and Resistance - Signals Alerts SL and TP by Tech Store On
The script uses MACD for entering/exiting trades and support/resistance lines to take TP1 (take profit 1). Both MACD and support/resistance lines are fully configurable to your preference, and you can back-test it via TradingView. Once TP1 is taken, you can either set the indicator to close the trade at the end of the US trading session day (4PM ET) or you can continue taking partial profits where you wish or just wait until reversal signal alert.
For example: If you will be day trading SPY and you wish to close your positions no matter what right before the market closes (3:45PM ET > 15min before closes): Make sure to checkbox “Intraday – Close Position Before Market Closes” in the strategy/indicator Settings, so that you are alerted soon before the market closes, if you wish to continue holding the position – leave this checkbox unchecked.
SL: SL is set to be slightly above/below the MACD signal candle, which is best suited for this strategy from manual backtesting.
Strategy Take Profit Approach
While the initial position open and SL hit is always based on a closed candle bar (can’t do otherwise, as otherwise you will have 10s of fake signal alerts), there are 2 ways on trading this strategy in terms of TP1 / TP1 taken > back to Entry, which is based off Alert type.
You can switch this as you like within the indicator settings, “Checked: TP1/TP1 taken > back to Entry per Price Touch | Unchecked: per Candle Close”.
Candle Close vs Price Touch: with the Default method - Candle Close for an alert for TP1 or if price comes back to Entry after TP1 is taken will only be triggered once candle bar fully closes crossing the area, while Price Touch will alert when price touches the area before candle bar closes.
For example: your trade is running well, you grab TP1 and the price reverses and hits your trade Entry area. With Price Touch – you are immediately alerted to close your trade with no loss and with TP1 profit. With Candle Close - you will receive an alert only once candle bar fully closes on top of the Entry crossing it backwards, meaning it may lower your TP1 profit or even completely reverse the trade into loss in case it will be a huge candle bar for any reason. However, it may touch the Entry area, looking like the price is reversing, but then continue per initial trade direction, sometimes becoming a trend. So, while Price Touch seem like a more conservative approach, Candle Close can give you much bigger profits if you catch a trend, but you can always change it via the Settings.
Note: TradingView back-testing engine does not have a feature to open/close orders IMMEDIATELY via Price Touch trigger, but only when the candle closes after price touches the scripted area/line/etc., so you for the most accurate results, test your strategy out via Candle Close setting. Otherwise, decide yourself. I personally like more Candle Close since I can test it out via back-testing with the most accurate results.
Note: If you will be observing the strategy LIVE, during LIVE candle bar movement – it will look weird, like it’s placing an order after order during any trigger – this seem like a TradingView bug, but is only observational, once the candle bar is closed and you refresh TradingView it will all look correct.
Back-Testing
If you wish to do some back-testing, just modify the strategy/indicator Settings:
-----1) STRATEGY: This is for back-testing/experimenting with the script inputs.
----------a. You can setup a start date (date, month, year) from which it will start opening back-test trades, select a position size and select TP1 size, the idea here is to close half (or whatever you choose) portion of the trade once you hit your TP1, then to either close at small profit or to catch a trend and close the second portion of the position long way ahead from Entry, otherwise it will alert you to close the position if price comes back to Entry, at reversal signal or at the end of US trading session if the option for it is checked. If you wish to close the whole position at TP1, just enter the same amount for TP1 to match backtest position size. Otherwise you can experiment with TP1 sizing – try it out!
-----2) Feel free to experiment with MACD settings and with S&R Left/Right bars, you may be amazed how results will differ and find some really cool combinations!
-----3) Make sure you select/de-select “Intraday – Close Position Before Market Closes” setting depending on what you are back-testing and on which conditions
-----4) Note: If you wish to do some deep back-testing (1+ years), use the “Deep Backtesting” feature within Strategy Tester on the TradingView as otherwise it may show wrong results or even fail to compute the results
Add the alerts
-----Right-click anywhere on the TradingView chart
-----Click on Add alert
-----Condition: MACD with Support and Resistance - Signals
----------o Right underneath the condition click on the drop-down menu and select “alert() function calls only”
-----Expiration time: Whatever you wish
-----Alert actions: Whatever notifications you wish
-----Alert name: DO NOT TOUCH THIS
-----Hit “Create”
-----Note: If you change ANY Settings within the indicator – you must DELETE the current alert and create a new one per steps above, otherwise it will continue triggering alerts per old Settings!
- Note: If you add the alert while the script is currently “In Position” it will not know that. So either wait when there will be no position open at all or close your position partially if the bot opens it twice bigger or so in case per script the bot will think it is already in position.
Note: Because of the slippage and the order processing time between TradingView, AutoView and the Broker (it’s usually about a second or so), it is suggested to not use a timeframe lower than 1min. The script is working really well with 15M/H1 timeframes per my back-testing, but feel free to explore via Strategy Back-testing what’s best for the instrument you wish to trade.

Ruckard TradingLatinoThis strategy tries to mimic TradingLatino strategy.
The current implementation is beta.
Si hablas castellano o espanyol por favor consulta MENSAJE EN CASTELLANO más abajo.
It's aimed at BTCUSDT pair and 4h timeframe.
STRATEGY DEFAULT SETTINGS EXPLANATION
max_bars_back=5000 : This is a random number of bars so that the strategy test lasts for one or two years
calc_on_order_fills=false : To wait for the 4h closing is too much. Try to check if it's worth entering a position after closing one. I finally decided not to recheck if it's worth entering after an order is closed. So it is false.
calc_on_every_tick=false
pyramiding=0 : We only want one entry allowed in the same direction. And we don't want the order to scale by error.
initial_capital=1000 : These are 1000 USDT. By using 1% maximum loss per trade and 7% as a default stop loss by using 1000 USDT at 12000 USDT per BTC price you would entry with around 142 USDT which are converted into: 0.010 BTC . The maximum number of decimal for contracts on this BTCUSDT market is 3 decimals. E.g. the minimum might be: 0.001 BTC . So, this minimal 1000 amount ensures us not to entry with less than 0.001 entries which might have happened when using 100 USDT as an initial capital.
slippage=1 : Binance BTCUSDT mintick is: 0.01. Binance slippage: 0.1 % (Let's assume). TV has an integer slippage. It does not have a percentage based slippage. If we assume a 1000 initial capital, the recommended equity is 142 which at 11996 USDT per BTC price means: 0.011 BTC. The 0.1% slippage of: 0.011 BTC would be: 0.000011 . This is way smaller than the mintick. So our slippage is going to be 1. E.g. 1 (slippage) * 0.01 (mintick)
commission_type=strategy.commission.percent and commission_value=0.1 : According to: binance . com / en / fee / schedule in VIP 0 level both maker and taker fees are: 0.1 %.
BACKGROUND
Jaime Merino is a well known Youtuber focused on crypto trading
His channel TradingLatino
features monday to friday videos where he explains his strategy.
JAIME MERINO STANCE ON BOTS
Jaime Merino stance on bots (taken from memory out of a 2020 June video from him):
'~
You know. They can program you a bot and it might work.
But, there are some special situations that the bot would not be able to handle.
And, I, as a human, I would handle it. And the bot wouldn't do it.
~'
My long term target with this strategy script is add as many
special situations as I can to the script
so that it can match Jaime Merino behaviour even in non normal circumstances.
My alternate target is learn Pine script
and enjoy programming with it.
WARNING
This script might be bigger than other TradingView scripts.
However, please, do not be confused because the current status is beta.
This script has not been tested with real money.
This is NOT an official strategy from Jaime Merino.
This is NOT an official strategy from TradingLatino . net .
HOW IT WORKS
It basically uses ADX slope and LazyBear's Squeeze Momentum Indicator
to make its buy and sell decisions.
Fast paced EMA being bigger than slow paced EMA
(on higher timeframe) advices going long.
Fast paced EMA being smaller than slow paced EMA
(on higher timeframe) advices going short.
It finally add many substrats that TradingLatino uses.
SETTINGS
__ SETTINGS - Basics
____ SETTINGS - Basics - ADX
(ADX) Smoothing {14}
(ADX) DI Length {14}
(ADX) key level {23}
____ SETTINGS - Basics - LazyBear Squeeze Momentum
(SQZMOM) BB Length {20}
(SQZMOM) BB MultFactor {2.0}
(SQZMOM) KC Length {20}
(SQZMOM) KC MultFactor {1.5}
(SQZMOM) Use TrueRange (KC) {True}
____ SETTINGS - Basics - EMAs
(EMAS) EMA10 - Length {10}
(EMAS) EMA10 - Source {close}
(EMAS) EMA55 - Length {55}
(EMAS) EMA55 - Source {close}
____ SETTINGS - Volume Profile
Lowest and highest VPoC from last three days
is used to know if an entry has a support
VPVR of last 100 4h bars
is also taken into account
(VP) Use number of bars (not VP timeframe): Uses 'Number of bars {100}' setting instead of 'Volume Profile timeframe' setting for calculating session VPoC
(VP) Show tick difference from current price {False}: BETA . Might be useful for actions some day.
(VP) Number of bars {100}: If 'Use number of bars (not VP timeframe)' is turned on this setting is used to calculate session VPoC.
(VP) Volume Profile timeframe {1 day}: If 'Use number of bars (not VP timeframe)' is turned off this setting is used to calculate session VPoC.
(VP) Row width multiplier {0.6}: Adjust how the extra Volume Profile bars are shown in the chart.
(VP) Resistances prices number of decimal digits : Round Volume Profile bars label numbers so that they don't have so many decimals.
(VP) Number of bars for bottom VPOC {18}: 18 bars equals 3 days in suggested timeframe of 4 hours. It's used to calculate lowest session VPoC from previous three days. It's also used as a top VPOC for sells.
(VP) Ignore VPOC bottom advice on long {False}: If turned on it ignores bottom VPOC (or top VPOC on sells) when evaluating if a buy entry is worth it.
(VP) Number of bars for VPVR VPOC {100}: Number of bars to calculate the VPVR VPoC. We use 100 as Jaime once used. When the price bounces back to the EMA55 it might just bounce to this VPVR VPoC if its price it's lower than the EMA55 (Sells have inverse algorithm).
____ SETTINGS - ADX Slope
ADX Slope
help us to understand if ADX
has a positive slope, negative slope
or it is rather still.
(ADXSLOPE) ADX cut {23}: If ADX value is greater than this cut (23) then ADX has strength
(ADXSLOPE) ADX minimum steepness entry {45}: ADX slope needs to be 45 degrees to be considered as a positive one.
(ADXSLOPE) ADX minimum steepness exit {45}: ADX slope needs to be -45 degrees to be considered as a negative one.
(ADXSLOPE) ADX steepness periods {3}: In order to avoid false detection the slope is calculated along 3 periods.
____ SETTINGS - Next to EMA55
(NEXTEMA55) EMA10 to EMA55 bounce back percentage {80}: EMA10 might bounce back to EMA55 or maybe to 80% of its complete way to EMA55
(NEXTEMA55) Next to EMA55 percentage {15}: How much next to the EMA55 you need to be to consider it's going to bounce back upwards again.
____ SETTINGS - Stop Loss and Take Profit
You can set a default stop loss or a default take profit.
(STOPTAKE) Stop Loss % {7.0}
(STOPTAKE) Take Profit % {2.0}
____ SETTINGS - Trailing Take Profit
You can customize the default trailing take profit values
(TRAILING) Trailing Take Profit (%) {1.0}: Trailing take profit offset in percentage
(TRAILING) Trailing Take Profit Trigger (%) {2.0}: When 2.0% of benefit is reached then activate the trailing take profit.
____ SETTINGS - MAIN TURN ON/OFF OPTIONS
(EMAS) Ignore advice based on emas {false}.
(EMAS) Ignore advice based on emas (On closing long signal) {False}: Ignore advice based on emas but only when deciding to close a buy entry.
(SQZMOM) Ignore advice based on SQZMOM {false}: Ignores advice based on SQZMOM indicator.
(ADXSLOPE) Ignore advice based on ADX positive slope {false}
(ADXSLOPE) Ignore advice based on ADX cut (23) {true}
(STOPTAKE) Take Profit? {false}: Enables simple Take Profit.
(STOPTAKE) Stop Loss? {True}: Enables simple Stop Loss.
(TRAILING) Enable Trailing Take Profit (%) {True}: Enables Trailing Take Profit.
____ SETTINGS - Strategy mode
(STRAT) Type Strategy: 'Long and Short', 'Long Only' or 'Short Only'. Default: 'Long and Short'.
____ SETTINGS - Risk Management
(RISKM) Risk Management Type: 'Safe', 'Somewhat safe compound' or 'Unsafe compound'. ' Safe ': Calculations are always done with the initial capital (1000) in mind. The maximum losses per trade/day/week/month are taken into account. ' Somewhat safe compound ': Calculations are done with initial capital (1000) or a higher capital if it increases. The maximum losses per trade/day/week/month are taken into account. ' Unsafe compound ': In each order all the current capital is gambled and only the default stop loss per order is taken into account. That means that the maximum losses per trade/day/week/month are not taken into account. Default : 'Somewhat safe compound'.
(RISKM) Maximum loss per trade % {1.0}.
(RISKM) Maximum loss per day % {6.0}.
(RISKM) Maximum loss per week % {8.0}.
(RISKM) Maximum loss per month % {10.0}.
____ SETTINGS - Decimals
(DECIMAL) Maximum number of decimal for contracts {3}: How small (3 decimals means 0.001) an entry position might be in your exchange.
EXTRA 1 - PRICE IS IN RANGE indicator
(PRANGE) Print price is in range {False}: Enable a bottom label that indicates if the price is in range or not.
(PRANGE) Price range periods {5}: How many previous periods are used to calculate the medians
(PRANGE) Price range maximum desviation (%) {0.6} ( > 0 ): Maximum positive desviation for range detection
(PRANGE) Price range minimum desviation (%) {0.6} ( > 0 ): Mininum negative desviation for range detection
EXTRA 2 - SQUEEZE MOMENTUM Desviation indicator
(SQZDIVER) Show degrees {False}: Show degrees of each Squeeze Momentum Divergence lines to the x-axis.
(SQZDIVER) Show desviation labels {False}: Whether to show or not desviation labels for the Squeeze Momentum Divergences.
(SQZDIVER) Show desviation lines {False}: Whether to show or not desviation lines for the Squeeze Momentum Divergences.
EXTRA 3 - VOLUME PROFILE indicator
WARNING: This indicator works not on current bar but on previous bar. So in the worst case it might be VP from 4 hours ago. Don't worry, inside the strategy calculus the correct values are used. It's just that I cannot show the most recent one in the chart.
(VP) Print recent profile {False}: Show Volume Profile indicator
(VP) Avoid label price overlaps {False}: Avoid label prices to overlap on the chart.
EXTRA 4 - ZIGNALY SUPPORT
(ZIG) Zignaly Alert Type {Email}: 'Email', 'Webhook'. ' Email ': Prepare alert_message variable content to be compatible with zignaly expected email content format. ' Webhook ': Prepare alert_message variable content to be compatible with zignaly expected json content format.
EXTRA 5 - DEBUG
(DEBUG) Enable debug on order comments {False}: If set to true it prepares the order message to match the alert_message variable. It makes easier to debug what would have been sent by email or webhook on each of the times an order is triggered.
HOW TO USE THIS STRATEGY
BOT MODE: This is the default setting.
PROPER VOLUME PROFILE VIEWING: Click on this strategy settings. Properties tab. Make sure Recalculate 'each time the order was run' is turned off.
NEWBIE USER: (Check PROPER VOLUME PROFILE VIEWING above!) You might want to turn on the 'Print recent profile {False}' setting. Alternatively you can use my alternate realtime study: 'Resistances and supports based on simplified Volume Profile' but, be aware, it might consume one indicator.
ADVANCED USER 1: Turn on the 'Print price is in range {False}' setting and help us to debug this subindicator. Also help us to figure out how to include this value in the strategy.
ADVANCED USER 2: Turn on the all the (SQZDIVER) settings and help us to figure out how to include this value in the strategy.
ADVANCED USER 3: (Check PROPER VOLUME PROFILE VIEWING above!) Turn on the 'Print recent profile {False}' setting and report any problem with it.
JAIME MERINO: Just use the indicator as it comes by default. It should only show BUY signals, SELL signals and their associated closing signals. From time to time you might want to check 'ADVANCED USER 2' instructions to check that there's actually a divergence. Check also 'ADVANCED USER 1' instructions for your amusement.
EXTRA ADVICE
It's advised that you use this strategy in addition to these two other indicators:
* Squeeze Momentum Indicator
* ADX
so that your chart matches as close as possible to TradingLatino chart.
ZIGNALY INTEGRATION
This strategy supports Zignaly email integration by default. It also supports Zignaly Webhook integration.
ZIGNALY INTEGRATION - Email integration example
What you would write in your alert message:
||{{strategy.order.alert_message}}||key=MYSECRETKEY||
ZIGNALY INTEGRATION - Webhook integration example
What you would write in your alert message:
{ {{strategy.order.alert_message}} , "key" : "MYSECRETKEY" }
CREDITS
I have reused and adapted some code from
'Directional Movement Index + ADX & Keylevel Support' study
which it's from TradingView console user.
I have reused and adapted some code from
'3ema' study
which it's from TradingView hunganhnguyen1193 user.
I have reused and adapted some code from
'Squeeze Momentum Indicator ' study
which it's from TradingView LazyBear user.
I have reused and adapted some code from
'Strategy Tester EMA-SMA-RSI-MACD' study
which it's from TradingView fikira user.
I have reused and adapted some code from
'Support Resistance MTF' study
which it's from TradingView LonesomeTheBlue user.
I have reused and adapted some code from
'TF Segmented Linear Regression' study
which it's from TradingView alexgrover user.
I have reused and adapted some code from
"Poor man's volume profile" study
which it's from TradingView IldarAkhmetgaleev user.
FEEDBACK
Please check the strategy source code for more detailed information
where, among others, I explain all of the substrats
and if they are implemented or not.
Q1. Did I understand wrong any of the Jaime substrats (which I have implemented)?
Q2. The strategy yields quite profit when we should long (EMA10 from 1d timeframe is higher than EMA55 from 1d timeframe.
Why the strategy yields much less profit when we should short (EMA10 from 1d timeframe is lower than EMA55 from 1d timeframe)?
Any idea if you need to do something else rather than just reverse what Jaime does when longing?
FREQUENTLY ASKED QUESTIONS
FAQ1. Why are you giving this strategy for free?
TradingLatino and his fellow enthusiasts taught me this strategy. Now I'm giving back to them.
FAQ2. Seriously! Why are you giving this strategy for free?
I'm confident his strategy might be improved a lot. By keeping it to myself I would avoid other people contributions to improve it.
Now that everyone can contribute this is a win-win.
FAQ3. How can I connect this strategy to my Exchange account?
It seems that you can attach alerts to strategies.
You might want to combine it with a paying account which enable Webhook URLs to work.
I don't know how all of this works right now so I cannot give you advice on it.
You will have to do your own research on this subject. But, be careful. Automating trades, if not done properly,
might end on you automating losses.
FAQ4. I have just found that this strategy by default gives more than 3.97% of 'maximum series of losses'. That's unacceptable according to my risk management policy.
You might want to reduce default stop loss setting from 7% to something like 5% till you are ok with the 'maximum series of losses'.
FAQ5. Where can I learn more about your work on this strategy?
Check the source code. You might find unused strategies. Either because there's not a substantial increases on earnings. Or maybe because they have not been implemented yet.
FAQ6. How much leverage is applied in this strategy?
No leverage.
FAQ7. Any difference with original Jaime Merino strategy?
Most of the times Jaime defines an stop loss at the price entry. That's not the case here. The default stop loss is 7% (but, don't be confused it only means losing 1% of your investment thanks to risk management). There's also a trailing take profit that triggers at 2% profit with a 1% trailing.
FAQ8. Why this strategy return is so small?
The strategy should be improved a lot. And, well, backtesting in this platform is not guaranteed to return theoric results comparable to real-life returns. That's why I'm personally forward testing this strategy to verify it.
MENSAJE EN CASTELLANO
En primer lugar se agradece feedback para mejorar la estrategia.
Si eres un usuario avanzado y quieres colaborar en mejorar el script no dudes en comentar abajo.
Ten en cuenta que aunque toda esta descripción tenga que estar en inglés no es obligatorio que el comentario esté en inglés.
CHISTE - CASTELLANO
¡Pero Jaime!
¡400.000!
¡Tu da mun!

Zulu Kilo 4HR Strategy - LIVE BETA TESTING***MANDATORY READING SO YOU DONT LOSE MONEY ON A POSITION***
I will be posting a video soon on my TV channel to explain exactly what you're about to read below so you can visually understand the process.
PLEASE NOTE THE FOLLOWING IMPORTANT CONDITIONS:
-The script DOES repaint since it looks for specific EMA conditions to meet position thresholds so there are some implications that MUST be observed BEFORE entering into a position.
-This script MUST be used in conjunction with at minimum 3 other indicators before entering the position it calls for you to enter, OR exiting a currently held position. Details on the bottom.
-The 3 recommended indicators that MUST be used in conjunction to verify position entry are: MACD, RSI and STOCH indicators.
-Do NOT change any of the settings in the script as it will not indicate the correct divergence/convergence for when to look for opening a position.
The three indicators I recommend in conjunction are all FREE indicators available openly on Tradingview Indicators:
(PLEASE NOTE THAT THE BELOW INDICATORS ARE NOT MINE, I GIVE ALL CREDIT TO THEIR ORIGINAL PUBLISHERS. THEY ARE *NOT* PART OF THIS SCRIPT.)
1) "Smooth Chande Trend Score w/ Signal line by CryptoRythms" (This is a volume weighed MACD indicator that shows convergence and divergence)
2) "STOCH_VX3" (This is a really smart and useful Stochastic indicator)
3) "CM_RSI Plus EMA" (This is an RSI trend indicator with an EMA reference line for added clarity of trend direction)
How to correctly use the Zulu Kilo indicator:
1) The time frame it is encoded for is the 4 hour time frame and that is what MUST be used to correctly identify a potential position entry/exit.
2) Getting into an initial position (when NOT currently in any position):
TWO OPTIONS:
A) ENTER INTO AN EXISTING SIGNAL
-IF indicator is showing an existing SHORT entry, the 3 other indicators must ALL be aligned crossing DOWN or trending downwards.
-IF indicator is showing a LONG entry, the 3 other indicators must ALL be aligned crossing UP or trending upwards.
B) ENTER INTO NEXT SIGNAL GENERATED
-Wait for indicator to generate a Short/Long position on a candle, DO NOT enter into that position until ALL 3 bottom indicators converge to pointing up (for a Long entry), or pointing down (for a Short entry).
-VERY IMPORTANT: It is NOT enough for the 3 bottom indicators to cross into a buy/sell until that 4 hr candle has closed with all 3 indicators trending up (for long) or trending down (for Short).
-I REPEAT **DO NOT** get into the indicated long/short position until the 4 hr candle has closed on the bottom three indicators as crossing up or down. There will be numerous times where on current 4hr candle, the 3 bottom indicators will cross into a buy/sell signal. That 4hr candle's price action CAN change until the current 4hr candle closes. IT IS NOT ENOUGH to get into any position indicated by my indicator unless the current 4hr candle where the bottom 3 indicators converge/cross up or down CLOSES the candle.
3) Exiting a position (Taking profit and entering new position):
-If you are in an existing position, please note that fake Long/Sell signals will be generated by the script. So when do you take profit from current position and enter the next position?
Scenario:
You are currently in a LONG position. Price goes up, there is price consolidation happening and a SHORT signal is generated. DO NOT immediately take profit and close your existing Long position yet. Unless, ALL 3 bottom indicators converge and cross downwards AFTER the current 4hr candle is confirmed, you will stay in your long position. You will ONLY exit and take profit / Stop Loss from your LONG position and go into a SHORT is when all 3 bottom indicators cross downwards on a 4hr candle close and confirm pointing/crossing down.
The exact inverse if you're in a SHORT position... If a LONG pops up while in a SHORT position, do NOT exit the SHORT immediately. Only exit the short, take profit, and then enter a long if all three indicators close on a 4hr candle where the 3 indicators are crossing up. If that does not happen, the long signal will disappear eventually, and you continue in the short position until another LONG signal pops up, repeat the same process.
***VERY IMPORTANT***
I cannot stress this enough!
I need all of the strategy followers to understand that the ONLY way you would ever enter into a signaled position is when a 4hr candle closes where the bottom 3 indicators are ALL crossing/pointing up (for a LONG) or ALL crossing/pointing down (for a SHORT).

SHEAVY S StrategyThe new version is completely revamped where you no longer need to follow a said system the system is now scripted into SHEAVY XV
the strategy using all the previous variables in order to go long or short .
i removed the RSI Candles as well as a few other things to clear up the screen and settings section so its not overwhelming
Make sure you adjust your trailing stop accordingly using my Hidden ATR script i will have open access too, just follow the math displayed in the left hand corner to get appropriate stop placement
If you cannot link your broker then this is how you will use SHEAVY XV
after you get a BEAR TREND or BULL TREND signal you only want to SHORT or LONG
the signals are displayed at the top for your entries going SHORT and LONG
and the conditional closes will be displayed at the bottom in the respected colors
alerts are set so you are able to appropriate send to your mobile device or email
to find out how to attain access to this script please visit the website below
www.cryptocurrentlyvip.com
MAKE SURE TO PRACTICE APPROPRIATE RISK AND MONEY MANAGEMENT
DISCLAIMER
***THIS SCRIPT WAS INTENDED FOR EXPERIMENTAL PURPOSES ONLY***
AND THE CREATOR OF THIS STRATEGY HELD WITHIN THE SCRIPT WILL NOT BE RESPONSIBLE FOR ANY LOSSES OR WINS ACCRUED.

PGT: Pretty Good TraderLittle bit of background :
I am a broke college student on the East coast, and I have developed a hobby for creating trading algorithms. This is one of the better scripts that I have written. Unfortunately, as a broke college student, I don't have the disposable income to actually trade using real money. If you are interested in donating to my broke college student fund, please message me!
On to the script :
This script was written in pine version 3 and does not calculate_on_tick . This means that it does not repaint . The numbers you see are, to the best of my knowledge, accurate.
Because most scripts tend to overfit data to generate the "best looking data", I decided to create an algorithm that would be generalizable as possible to a diverse number of trading pairs. This script works on both crytpo markets(works best on smaller time frame) and stock markets(works best on larger time frames).
I am publishing this script to both gauge and generate interest in a Python trading bot which I have written which automatically buys and sells on different exchanges by using the predictive signals of this indicator.

BitcoinNinjas Ninja Signals Buy/Sell Alert Trading Strategy v3.0Bitcoin Ninjas 'Ninja Signals' Buy/Sell Alerts & Backtesting TradingView Script v3.0
(for Cryptocurrencies, Forex, GunBot, ProfitTrailer, automatic trading software, and more)
This is version 3 of our popular Ninja Signals trading script, which is similar to version 2, but with a new hard-coded calibration (resolution) setting that automatically matches candle size (period) to ensure that no repainting occurs regardless of the number or type of indicators and filters traders apply when configuring the script.
'Ninja Signals' v3.0 (SCRIPT)
'Ninja Signals' v3.0 (STRATEGY)
'Ninja Signals' v2.0 (SCRIPT)
'Ninja Signals' v2.0 (STRATEGY)
'Ninja Signals' v1.0 (SCRIPT)
'Ninja Signals' v1.0 (STRATEGY)
-Allows users to easily set automated buy and sell alerts on TradingView for use with automatic and manual trading of cryptocurrencies, Forex securities, and more (alerts are compatible with automatic trading software such as GunBot, ProfitTrailer, and more).
-Synthesizes many powerful indicators [e.g. Relative Strength Index (RSI), stochastic RSI, Money Flow Index (MFI), Moving Average Convergence Divergence (MACD), etc.) into one super script to generate very precise buy and sell signals in almost any market condition.
-Buy arrows (blue) and sell arrows (red) can be changed or hidden for ease of viewing.
-No lag EMA trendline featuring trend-reversal color-coding (white uptrend, black downtrend).
-Adjustable ‘calibration’ setting allows users to customize the script to work for any currency or security available through TradingView, on any exchange, simply by adjusting a number.
-Complete with backtesting strategy version of script which allows users to test various buy and sell strategies based on the alerts the script generates (see info and screenshots below).
-Backtesting strategy incorporates a user-defined adjustable date range, so users can estimate the script’s performance over specific periods of time, such as the last day, week, or month.
-Backtesting strategy utilizes a minimum protective gain setting to help you never sell for a loss. Simply adjust your minimum profit (%) per trade, and the test results will update.
-Backtesting strategy allows for pyramid buying to test various average down / double up buying strategies. Simply adjust the number of pyramid buys and the quantity of each buy.
- Free 7-day trial available for TradingView users who join our free BitcoinNinjas community.
-Free 24/7 support via BitcoinNinjas Telegram GunBot support group with script purchase.
-Fully compatible with GunBot automatic trading software (TradingView plugin is required).
-Special discount available for traders who purchase GunBot automatic trading software and the GunBot TradingView plugin from BitcoinNinjas, allowing for fully automatic trading.
-Contact us via Email or Telegram for more information, to request additional / custom screenshots, or to start your free trial.
DISCLAIMER: By using our BitcoinNinjas ‘Ninja Signals’ planning script, you agree to the BitcoinNinjas 'Terms of Use', as presented on our website (www.BitcoinNinjas.org) and as stated here. No sharing, copying, reselling, modifying, or any other forms of use are authorized for our documents, script / strategy, and the information published with them. This informational planning script / strategy is strictly for individual use and educational purposes only. This is not financial or investment advice. Investments are always made at your own risk and are based on your personal judgement. Bitcoin Ninjas is not responsible for any losses you may incur. Please invest wisely.
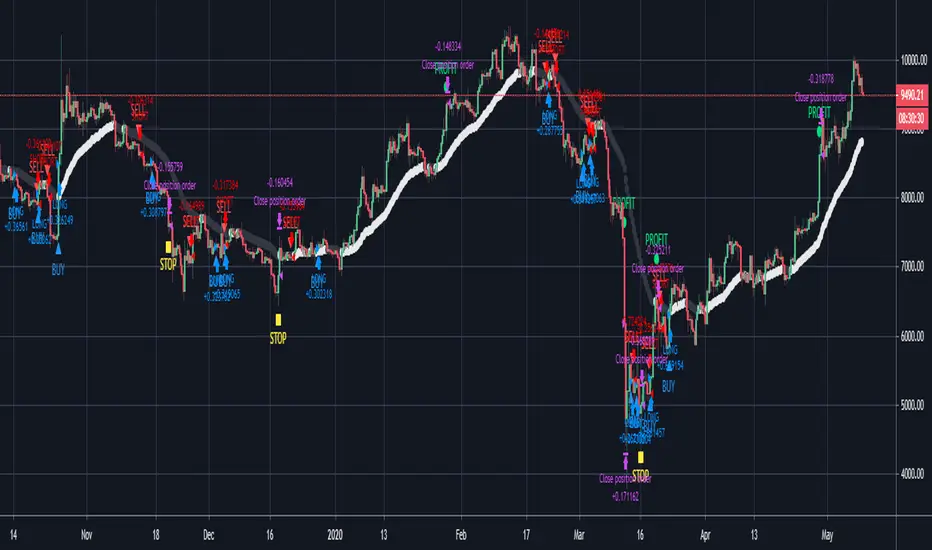
Range Oscillator Strategy + Stoch Confirm🔹 Short summary
This is a free, educational long-only strategy built on top of the public “Range Oscillator” by Zeiierman (used under CC BY-NC-SA 4.0), combined with a Stochastic timing filter, an EMA-based exit filter and an optional risk-management layer (SL/TP and R-multiple exits). It is NOT financial advice and it is NOT a magic money machine. It’s a structured framework to study how range-expansion + momentum + trend slope can be combined into one rule-based system, often with intentionally RARE trades.
────────────────────────
0. Legal / risk disclaimer
────────────────────────
• This script is FREE and public. I do not charge any fee for it.
• It is for EDUCATIONAL PURPOSES ONLY.
• It is NOT financial advice and does NOT guarantee profits.
• Backtest results can be very different from live results.
• Markets change over time; past performance is NOT indicative of future performance.
• You are fully responsible for your own trades and risk.
Please DO NOT use this script with money you cannot afford to lose. Always start in a demo / paper trading environment and make sure you understand what the logic does before you risk any capital.
────────────────────────
1. About default settings and risk (very important)
────────────────────────
The script is configured with the following defaults in the `strategy()` declaration:
• `initial_capital = 10000`
→ This is only an EXAMPLE account size.
• `default_qty_type = strategy.percent_of_equity`
• `default_qty_value = 100`
→ This means 100% of equity per trade in the default properties.
→ This is AGGRESSIVE and should be treated as a STRESS TEST of the logic, not as a realistic way to trade.
TradingView’s House Rules recommend risking only a small part of equity per trade (often 1–2%, max 5–10% in most cases). To align with these recommendations and to get more realistic backtest results, I STRONGLY RECOMMEND you to:
1. Open **Strategy Settings → Properties**.
2. Set:
• Order size: **Percent of equity**
• Order size (percent): e.g. **1–2%** per trade
3. Make sure **commission** and **slippage** match your own broker conditions.
• By default this script uses `commission_value = 0.1` (0.1%) and `slippage = 3`, which are reasonable example values for many crypto markets.
If you choose to run the strategy with 100% of equity per trade, please treat it ONLY as a stress-test of the logic. It is NOT a sustainable risk model for live trading.
────────────────────────
2. What this strategy tries to do (conceptual overview)
────────────────────────
This is a LONG-ONLY strategy designed to explore the combination of:
1. **Range Oscillator (Zeiierman-based)**
- Measures how far price has moved away from an adaptive mean.
- Uses an ATR-based range to normalize deviation.
- High positive oscillator values indicate strong price expansion away from the mean in a bullish direction.
2. **Stochastic as a timing filter**
- A classic Stochastic (%K and %D) is used.
- The logic requires %K to be below a user-defined level and then crossing above %D.
- This is intended to catch moments when momentum turns up again, rather than chasing every extreme.
3. **EMA Exit Filter (trend slope)**
- An EMA with configurable length (default 70) is calculated.
- The slope of the EMA is monitored: when the slope turns negative while in a long position, and the filter is enabled, it triggers an exit condition.
- This acts as a trend-protection exit: if the medium-term trend starts to weaken, the strategy exits even if the oscillator has not yet fully reverted.
4. **Optional risk-management layer**
- Percentage-based Stop Loss and Take Profit (SL/TP).
- Risk/Reward (R-multiple) exit based on the distance from entry to SL.
- Implemented as OCO orders that work *on top* of the logical exits.
The goal is not to create a “holy grail” system but to serve as a transparent, configurable framework for studying how these concepts behave together on different markets and timeframes.
────────────────────────
3. Components and how they work together
────────────────────────
(1) Range Oscillator (based on “Range Oscillator (Zeiierman)”)
• The script computes a weighted mean price and then measures how far price deviates from that mean.
• Deviation is normalized by an ATR-based range and expressed as an oscillator.
• When the oscillator is above the **entry threshold** (default 100), it signals a strong move away from the mean in the bullish direction.
• When it later drops below the **exit threshold** (default 30), it can trigger an exit (if enabled).
(2) Stochastic confirmation
• Classic Stochastic (%K and %D) is calculated.
• An entry requires:
- %K to be below a user-defined “Cross Level”, and
- then %K to cross above %D.
• This is a momentum confirmation: the strategy tries to enter when momentum turns up from a pullback rather than at any random point.
(3) EMA Exit Filter
• The EMA length is configurable via `emaLength` (default 70).
• The script monitors the EMA slope: it computes the relative change between the current EMA and the previous EMA.
• If the slope turns negative while the strategy holds a long position and the filter is enabled, it triggers an exit condition.
• This is meant to help protect profits or cut losses when the medium-term trend starts to roll over, even if the oscillator conditions are not (yet) signalling exit.
(4) Risk management (optional)
• Stop Loss (SL) and Take Profit (TP):
- Defined as percentages relative to average entry price.
- Both are disabled by default, but you can enable them in the Inputs.
• Risk/Reward Exit:
- Uses the distance from entry to SL to project a profit target at a configurable R-multiple.
- Also optional and disabled by default.
These exits are implemented as `strategy.exit()` OCO orders and can close trades independently of oscillator/EMA conditions if hit first.
────────────────────────
4. Entry & Exit logic (high level)
────────────────────────
A) Time filter
• You can choose a **Start Year** in the Inputs.
• Only candles between the selected start date and 31 Dec 2069 are used for backtesting (`timeCondition`).
• This prevents accidental use of tiny cherry-picked windows and makes tests more honest.
B) Entry condition (long-only)
A long entry is allowed when ALL the following are true:
1. `timeCondition` is true (inside the backtest window).
2. If `useOscEntry` is true:
- Range Oscillator value must be above `entryLevel`.
3. If `useStochEntry` is true:
- Stochastic condition (`stochCondition`) must be true:
- %K < `crossLevel`, then %K crosses above %D.
If these filters agree, the strategy calls `strategy.entry("Long", strategy.long)`.
C) Exit condition (logical exits)
A position can be closed when:
1. `timeCondition` is true AND a long position is open, AND
2. At least one of the following is true:
- If `useOscExit` is true: Oscillator is below `exitLevel`.
- If `useMagicExit` (EMA Exit Filter) is true: EMA slope is negative (`isDown = true`).
In that case, `strategy.close("Long")` is called.
D) Risk-management exits
While a position is open:
• If SL or TP is enabled:
- `strategy.exit("Long Risk", ...)` places an OCO stop/limit order based on the SL/TP percentages.
• If Risk/Reward exit is enabled:
- `strategy.exit("RR Exit", ...)` places an OCO order using a projected R-multiple (`rrMult`) of the SL distance.
These risk-based exits can trigger before the logical oscillator/EMA exits if price hits those levels.
────────────────────────
5. Recommended backtest configuration (to avoid misleading results)
────────────────────────
To align with TradingView House Rules and avoid misleading backtests:
1. **Initial capital**
- 10 000 (or any value you personally want to work with).
2. **Order size**
- Type: **Percent of equity**
- Size: **1–2%** per trade is a reasonable starting point.
- Avoid risking more than 5–10% per trade if you want results that could be sustainable in practice.
3. **Commission & slippage**
- Commission: around 0.1% if that matches your broker.
- Slippage: a few ticks (e.g. 3) to account for real fills.
4. **Timeframe & markets**
- Volatile symbols (e.g. crypto like BTCUSDT, or major indices).
- Timeframes: 1H / 4H / **1D (Daily)** are typical starting points.
- I strongly recommend trying the strategy on **different timeframes**, for example 1D, to see how the behaviour changes between intraday and higher timeframes.
5. **No “caution warning”**
- Make sure your chosen symbol + timeframe + settings do not trigger TradingView’s caution messages.
- If you see warnings (e.g. “too few trades”), adjust timeframe/symbol or the backtest period.
────────────────────────
5a. About low trade count and rare signals
────────────────────────
This strategy is intentionally designed to trade RARELY:
• It is **long-only**.
• It uses strict filters (Range Oscillator threshold + Stochastic confirmation + optional EMA Exit Filter).
• On higher timeframes (especially **1D / Daily**) this can result in a **low total number of trades**, sometimes WELL BELOW 100 trades over the whole backtest.
TradingView’s House Rules mention 100+ trades as a guideline for more robust statistics. In this specific case:
• The **low trade count is a conscious design choice**, not an attempt to cherry-pick a tiny, ultra-profitable window.
• The goal is to study a **small number of high-conviction long entries** on higher timeframes, not to generate frequent intraday signals.
• Because of the low trade count, results should NOT be interpreted as statistically strong or “proven” – they are only one sample of how this logic would have behaved on past data.
Please keep this in mind when you look at the equity curve and performance metrics. A beautiful curve with only a handful of trades is still just a small sample.
────────────────────────
6. How to use this strategy (step-by-step)
────────────────────────
1. Add the script to your chart.
2. Open the **Inputs** tab:
- Set the backtest start year.
- Decide whether to use Oscillator-based entry/exit, Stochastic confirmation, and EMA Exit Filter.
- Optionally enable SL, TP, and Risk/Reward exits.
3. Open the **Properties** tab:
- Set a realistic account size if you want.
- Set order size to a realistic % of equity (e.g. 1–2%).
- Confirm that commission and slippage are realistic for your broker.
4. Run the backtest:
- Look at Net Profit, Max Drawdown, number of trades, and equity curve.
- Remember that a low trade count means the statistics are not very strong.
5. Experiment:
- Tweak thresholds (`entryLevel`, `exitLevel`), Stochastic settings, EMA length, and risk params.
- See how the metrics and trade frequency change.
6. Forward-test:
- Before using any idea in live trading, forward-test on a demo account and observe behaviour in real time.
────────────────────────
7. Originality and usefulness (why this is more than a mashup)
────────────────────────
This script is not intended to be a random visual mashup of indicators. It is designed as a coherent, testable strategy with clear roles for each component:
• Range Oscillator:
- Handles mean vs. range-expansion states via an adaptive, ATR-normalized metric.
• Stochastic:
- Acts as a timing filter to avoid entering purely on extremes and instead waits for momentum to turn.
• EMA Exit Filter:
- Trend-slope-based safety net to exit when the medium-term direction changes against the position.
• Risk module:
- Provides practical, rule-based exits: SL, TP, and R-multiple exit, which are useful for structuring risk even if you modify the core logic.
It aims to give traders a ready-made **framework to study and modify**, not a black box or “signals” product.
────────────────────────
8. Limitations and good practices
────────────────────────
• No single strategy works on all markets or in all regimes.
• This script is long-only; it does not short the market.
• Performance can degrade when market structure changes.
• Overfitting (curve fitting) is a real risk if you endlessly tweak parameters to maximise historical profit.
Good practices:
- Test on multiple symbols and timeframes.
- Focus on stability and drawdown, not only on how high the profit line goes.
- View this as a learning tool and a basis for your own research.
────────────────────────
9. Licensing and credits
────────────────────────
• Core oscillator idea & base code:
- “Range Oscillator (Zeiierman)”
- © Zeiierman, licensed under CC BY-NC-SA 4.0.
• Strategy logic, Stochastic confirmation, EMA Exit Filter, and risk-management layer:
- Modifications by jokiniemi.
Please respect both the original license and TradingView House Rules if you fork or republish any part of this script.
────────────────────────
10. No payments / no vendor pitch
────────────────────────
• This script is completely FREE to use on TradingView.
• There is no paid subscription, no external payment link, and no private signals group attached to it.
• If you have questions, please use TradingView’s comment system or private messages instead of expecting financial advice.
Use this script as a tool to learn, experiment, and build your own understanding of markets.
────────────────────────
11. Example backtest settings used in screenshots
────────────────────────
To avoid any confusion about how the results shown in screenshots were produced, here is one concrete example configuration:
• Symbol: BTCUSDT (or similar major BTC pair)
• Timeframe: 1D (Daily)
• Backtest period: from 2018 to the most recent data
• Initial capital: 10 000
• Order size type: Percent of equity
• Order size: 2% per trade
• Commission: 0.1%
• Slippage: 3 ticks
• Risk settings: Stop Loss and Take Profit disabled by default, Risk/Reward exit disabled by default
• Filters: Range Oscillator entry/exit enabled, Stochastic confirmation enabled, EMA Exit Filter enabled
If you change any of these settings (symbol, timeframe, risk per trade, commission, slippage, filters, etc.), your results will look different. Please always adapt the configuration to your own risk tolerance, market, and trading style.

JMA Quantum Edge: Adaptive Precision Trading System JMA Quantum Edge: Adaptive Precision Trading System - Enhanced Visuals & Risk Management
Get ready to experience a groundbreaking trading strategy that adapts in real-time to market conditions! This powerful, open-source script combines advanced technical analysis with state-of-the-art risk management tools, designed to give you the edge you need in today's dynamic markets.
What It Does:
Adaptive JMA Indicator:
Utilizes a custom Jurik Moving Average (JMA) that adjusts its sensitivity based on market volatility, ensuring you get precise signals even in the most fluctuating environments.
Dynamic Risk Management:
Features built-in support for partial exits (scaling out) to secure profits, along with an optional Kelly Criterion-based position sizing that tailors your exposure based on historical performance metrics.
Robust Error Handling:
Incorporates market condition filters—like minimum volume and maximum allowed gap percentage—to ensure trades are only executed under favorable conditions.
Vivid Visual Enhancements:
Enjoy an animated background that reflects market momentum, dynamic pivot markers, and clearly drawn trend channels. Plus, interactive tables provide real-time performance analytics and detailed error metrics.
Fully Customizable:
With a comprehensive set of inputs, you can easily tailor the strategy to your personal trading style and market preferences. Adjust everything from JMA parameters to refresh intervals for tables and labels!
How to Use It:
Add the Script:
Copy and paste the script into the Pine Script Editor on TradingView and click “Add to Chart.”
Configure Your Settings:
Customize your risk management (capital, commission, position sizing, partial exits, etc.) and tweak the JMA settings to match your preferred trading style. Use the extensive input panel to adjust visuals, alerts, and more.
Backtest & Optimize:
Run the strategy in the Strategy Tester to analyze its historical performance. Monitor real-time analytics and error metrics via the interactive tables, and fine-tune your parameters for optimal performance.
Go Live with Confidence:
Once you're satisfied with the backtest results, use the generated signals for live trading, and let the system help you stay ahead in fast-paced markets!
How to use the imputs:
This cutting-edge strategy is designed to adapt to changing market conditions and offers you complete control over your trading parameters. Here’s a breakdown of what each group of inputs does and how you should use them:
Risk Management & Trade Settings
Recalculate on Every Tick:
What it does: When enabled, the strategy recalculates on every price update.
Recommendation: Leave it true for fast charts.
Initial Capital:
What it does: Sets your starting capital for backtesting, which influences position sizing and performance metrics.
Recommendation: Start with $10,000 (or adjust according to your trading capital).
Commission (%):
What it does: Simulates the cost per trade.
Recommendation: Use a realistic rate (e.g., 0.04%).
Position Size & Quantity Type:
What they do: Define how large each trade will be. Choose between a fixed unit amount or a percentage of equity.
Recommendation: For beginners, the default fixed value is a good start. Experiment later with percentage-based sizing if needed.
Order Comment:
What it does: Adds a label to your orders for easier tracking.
Allow Reverse Orders:
What it does: If disabled, the strategy will close opposing positions before entering a new trade, reducing conflicts.
Enable Dynamic Position Sizing:
What it does: Adjusts trade size based on current volatility.
Recommendation: Beginners may start with this disabled until they understand basic sizing.
Partial Exit Inputs:
What they do:
Enable Partial Exits: When turned on, you can scale out of your position to lock in profits.
Partial Exit Profit (%): The profit percentage that triggers a partial exit.
Partial Exit Percentage: The percentage of your current position to exit. Recommendation: Use defaults (e.g., 5% profit, 50% exit) to secure profits gradually.
Kelly Criterion Option:
What it does: When enabled, adjusts your position sizing using historical performance (win rate and profit factor).
Recommendation: Beginners might leave this disabled until comfortable with backtest performance metrics.
Market Condition Filters:
What they do:
Minimum Volume: Ensures trades occur only when there’s sufficient market activity.
Maximum Gap (%): Prevents trading if there’s an unusually large gap between the previous close and current open. Recommendation: Defaults work well for most markets. If trades seem erratic, consider tightening these limits.
JMA Settings
Price Source:
What it does: The input series for the JMA calculation, typically set to the closing price.
JMA Length:
What it does: Controls the smoothing period of the JMA. Lower values are more sensitive; higher values smooth out the noise. Recommendation: Start with 21.
JMA Phase & Power:
What they do: Adjust how responsive the JMA is. Phase controls timing; power adjusts the intensity. Recommendation: Default settings (63 phase and 3 power) are a balanced starting point.
Visual Settings & Style
Show JMA Line, Pivot Lines, and Pivot Labels:
What they do: Toggle visual elements on your chart for easier signal identification.
Pivot History Count:
What it does: Limits how many historical pivot markers are displayed.
Color Settings (Up/Down Neon Colors):
What they do: Set the visual cues for buy and sell signals.
Pivot Marker & Line Style:
What they do: Choose the style and thickness of your pivot markers and lines.
Show Stats Panel:
What it does: Displays real-time performance and error metrics.
Dynamic Background & Visual Enhancements
Animate Background:
What it does: Changes the background color based on market momentum.
Show Trend Channels & Volume Zones:
What they do: Draw trend channels and highlight areas of high volatility/volume.
Show Data-Rich Labels:
What it does: Displays key metrics like volume, error percentage, and momentum on the chart.
High Volatility Threshold:
What it does: Determines the multiplier for when the chart background should change due to high volatility.
Multi-Timeframe Settings
Higher Timeframe:
What it does: Uses a higher timeframe’s JMA for trend confirmation. Recommendation: Use Daily ('D') or Weekly ('W') for broader trend analysis.
Show HTF Trend Zone & Opacity:
What they do: Display a visual zone from the higher timeframe to help confirm trends.
6. Trailing Stop Settings
Trailing Stop ATR Factor & Offset Multiplier:
What they do: Calculate trailing stops based on the Average True Range (ATR), adjusting stop distances dynamically. Recommendation: Default settings are a good balance but can be fine-tuned based on asset volatility.
Alerts & Notifications
Alerts on Pivot Formation & JMA Crossover:
What they do: Notify you when key events occur.
Dynamic Power Threshold:
What it does: Sets the sensitivity for dynamic alerts.
8. Static Stop Loss / Take Profit
Static Stop Loss (%) & Take Profit (%):
What they do: Allow you to set fixed stop loss or take profit levels. Recommendation: Leave them at 0 to disable if you prefer dynamic risk management, or set them if you have strict risk/reward preferences.
Advanced Settings
ATR Length:
What it does: Determines the period for ATR calculation, impacting trailing stop sensitivity. Recommendation: Start with 14.
Optimization Feedback & Enhanced Error Analysis
Error Metric Length & Error Threshold (%):
What they do: Calculate error metrics (like average error, skewness, and kurtosis) to help you fine-tune the JMA. Recommendation: Use the defaults and adjust if the error metrics seem off during backtesting.
UI - User-Driven Tweaking & Table Customization
Parameter Tweaker Panel, Debug/Performance Table Settings:
What they do: Provide interactive tables that display real-time performance, error metrics, and allow you to monitor strategy parameters.
Refresh Frequency Options (Table & Label Refresh Intervals):
What they do: Set how often the tables and labels update.
Recommendation: Start with an interval of 1 bar; increase it if your chart is too busy.
Important for Beginners:
Default Settings:
All default values have been chosen for balanced performance across different markets. If you ever experience unexpected behavior, start by resetting the inputs to their defaults.
Step-by-Step Adjustments:
Experiment by changing one setting at a time while observing how the strategy’s signals and performance metrics change. This will help you understand the impact of each parameter.
Resetting to Defaults:
If things seem off or you’re not getting the expected results, you can always reset the indicator. Either reload the script or use the “Reset Inputs” option (if available) to revert to the default settings.
Jump in, experiment, and enjoy the power of adaptive precision trading. This strategy is built to grow with your skills—have fun exploring and refining your trading edge!
Happy trading!

HOD/LOD/PMH/PML/PDH/PDL Strategy by @tradingbauhaus This script is a trading strategy @tradingbauhaus designed to trade based on key price levels, such as the High of Day (HOD), Low of Day (LOD), Premarket High (PMH), Premarket Low (PML), Previous Day High (PDH), and Previous Day Low (PDL). Below, I’ll explain in detail what the script does:
Core Functionality of the Script:
Calculates Key Price Levels:
HOD (High of Day): The highest price of the current day.
LOD (Low of Day): The lowest price of the current day.
PMH (Premarket High): The highest price during the premarket session (before the market opens).
PML (Premarket Low): The lowest price during the premarket session.
PDH (Previous Day High): The highest price of the previous day.
PDL (Previous Day Low): The lowest price of the previous day.
Draws Horizontal Lines on the Chart:
Plots horizontal lines on the chart for each key level (HOD, LOD, PMH, PML, PDH, PDL) with specific colors for easy visual identification.
Defines Entry and Exit Rules:
Long Entry (Buy): If the price crosses above the PMH (Premarket High) or the PDH (Previous Day High).
Short Entry (Sell): If the price crosses below the PML (Premarket Low) or the PDL (Previous Day Low).
Long Exit: If the price reaches the HOD (High of Day) during a long position.
Short Exit: If the price reaches the LOD (Low of Day) during a short position.
How the Script Works Step by Step:
Calculates Key Levels:
Uses the request.security function to fetch the HOD and LOD of the current day, as well as the highs and lows of the previous day (PDH and PDL).
Calculates the PMH and PML during the premarket session (before 9:30 AM).
Plots Levels on the Chart:
Uses the plot function to draw horizontal lines on the chart representing the key levels (HOD, LOD, PMH, PML, PDH, PDL).
Each level has a specific color for easy identification:
HOD: White.
LOD: Purple.
PDH: Orange.
PDL: Blue.
PMH: Green.
PML: Red.
Defines Trading Rules:
Uses conditions with ta.crossover and ta.crossunder to detect when the price crosses key levels.
Long Entry: If the price crosses above the PMH or PDH, a long position (buy) is opened.
Short Entry: If the price crosses below the PML or PDL, a short position (sell) is opened.
Long Exit: If the price reaches the HOD during a long position, the position is closed.
Short Exit: If the price reaches the LOD during a short position, the position is closed.
Executes Orders Automatically:
Uses the strategy.entry and strategy.close functions to open and close positions automatically based on the defined rules.
Advantages of This Strategy:
Based on Key Levels: Uses important price levels that often act as support and resistance.
Easy to Visualize: Horizontal lines on the chart make it easy to identify levels.
Automated: Entries and exits are executed automatically based on the defined rules.
Limitations of This Strategy:
Dependent on Volatility: Works best in markets with significant price movements.
False Crosses: There may be false crosses that generate incorrect signals.
No Advanced Risk Management: Does not include dynamic stop-loss or take-profit mechanisms.
How to Improve the Strategy:
Add Stop-Loss and Take-Profit: To limit losses and lock in profits.
Filter Signals with Indicators: Use RSI, MACD, or other indicators to confirm signals.
Optimize Levels: Adjust key levels based on the asset’s behavior.
In summary, this script is a trading strategy that operates based on key price levels, such as HOD, LOD, PMH, PML, PDH, and PDL. It is useful for traders who want to trade based on significant support and resistance levels.
